Time Weighted Returns Explained: Definitions, Formulas & Examples
Time weighted returns (TWR) is an indispensable metric used to evaluate the time-weighted rate of return and investment portfolio performance while adjusting for external cash flows. By stripping out liquidity impacts outside a manager’s control, TWR provides a clearer measure of an investment manager’s performance or strategy’s effectiveness. This article explains time weighted returns, holdings intervals and sub-periods used in TWR calculation, how money flows can distort returns measures (Money-weighted return), differences from Internal Rate of Return (IRR), and applications in benchmark comparison and portfolio management.
Formula for TWR
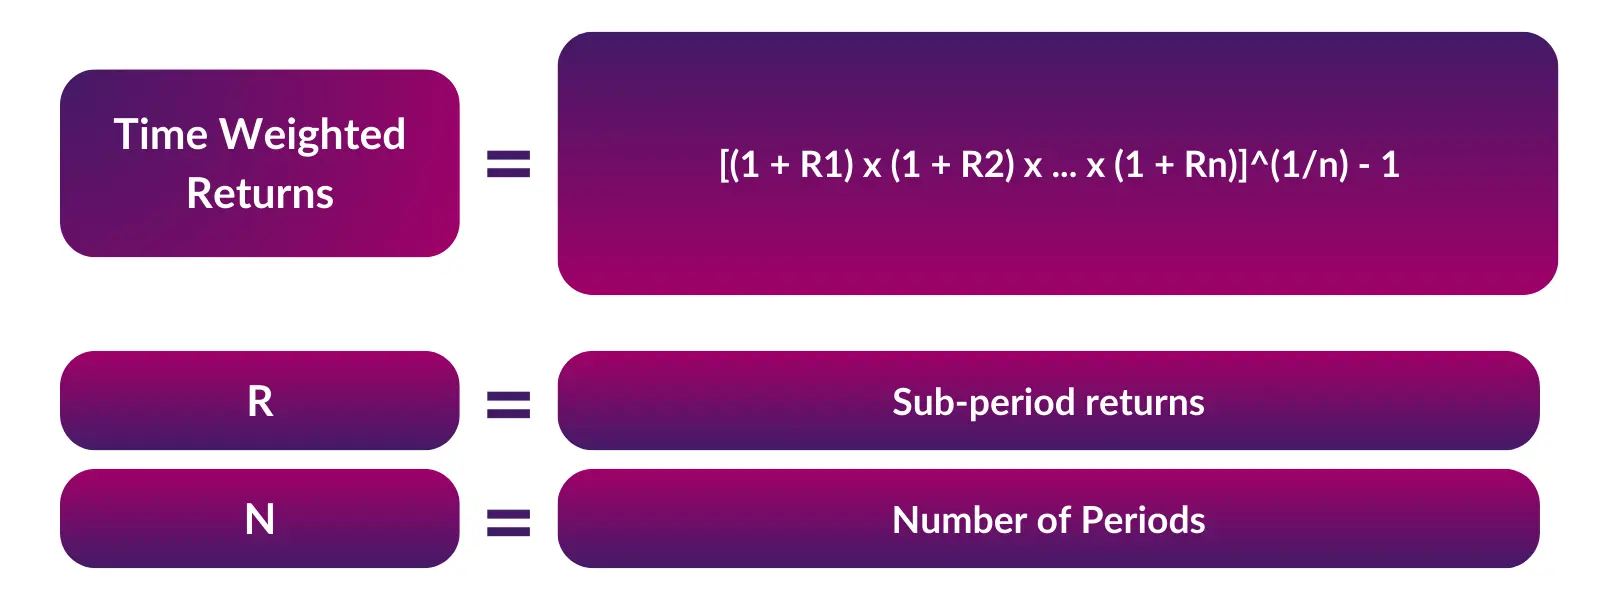
The TWR formula compound links sub-period returns geometrically to derive an annual rate of return adjusted for irregular cash flows:
TWR = [(1 + R1) x (1 + R2) x … x (1 + Rn)]^(1/n) – 1
Where:
- R1……Rn = Sub-period returns. Each sub-period is defined by the timing of when flows come into / out of the fund
- n = Number of sub-periods
This formula assumes that each sub-period is the same length.
TWR vs Other Metrics: MWR, IRR
TWR differs from money weighted returns (MWR) which reflects an investor’s experience including timing and size of cash flows. The MWR is the same as the IRR and therefore does consider the timing and size of cash flows (in or out) over the life of an investment. The TWR is a ‘pure’ measure of fund performance, ignoring the impact of inflows and outflow. TWR therefore isolates the portfolio manager’s effectiveness.
Calculating TWR in Excel Step-by-Step
The key steps are:
- Segregate performance timeline into sub-periods determined by cash flows
- Calculate interval returns for each sub-period
- Chain sub-period returns geometrically to derive TWR (we can use the =GEOMEAN function in Excel!)
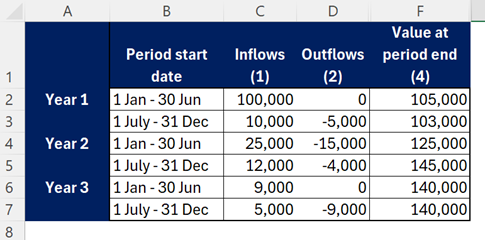
For example, take the following table showing fund inflows, outflows and valuations.
A money-weighted return (relevant and informative if the cash flows came from the same investor) would be the IRR of the flows (showing investments as negative):
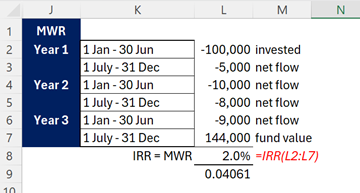
This is the periodic TWR (so a half-year return). An annualised equivalent would be (1+2%)^2-1 =4.06%
For the TWR, we need to firstly identify the Value at the period Start, as well as the end. Then calculated the periodic returns, then find the compound average (geometric average) of these over the full period.
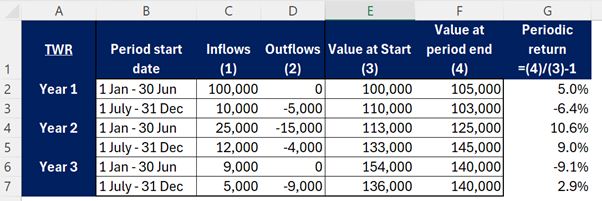
The average return per period is then (1.05)*(0.9360)*(1.106)*(1.09)*(0.909)*(1.029) ^ (1/6) – 1 = 1.73%.
Or in Excel, use the =GEOMEAN function:
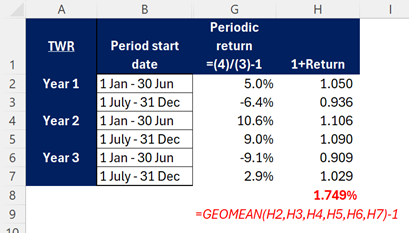
Note: the difference is purely due to the rounding of the % returns in the manual calculation giving 1.73% rather than the exact 1.749%.
TWR vs MWR in this example:
Comparing the calculations for TWR and MWR:
MWR = 2% per half-year. An investor in the fund, with withdrawals / investments, managed to achieve a return of 2%
TWR = 1.749%. this is the pure fund performance, and anything extra, included in the 2% MWR, was purely due to the ‘luck’ of investment/ withdrawal timings over this period
Applications in Investment Analysis
Key applications of TWR in investment analysis and portfolio management include:
- Evaluating investment manager skill relative to benchmarks by adjusting for cash flow impacts
- Comparing performance of funds and managers on a risk-adjusted basis
- Determining value contributed by manager’s strategy vs. investor timings
TWR helps construct optimal portfolios by providing clearer insights on drivers of investment portfolio performance whilst eliminating distortions from cash flow timings outside the fund-managers control.
Limitations of TWR
While invaluable in performance measurement, limitations of TWR should be recognized:
- May deviate from investor experience as external flows are removed
- Less applicable for irregular cash flow investments like private equity
- Returns for volatile assets still exhibit interim fluctuations (between valuation dates) and these are ignored.
- Requires assumptions on sub-period flow timings
In summary, TWR is an integral investment performance metric with a variety of applications in portfolio analysis, manager evaluation and risk-adjustment – despite some limitations. Its ability to isolate investment selection skill makes TWR a key tool for corporate finance and investment strategy effectiveness assessment.


