Return on Invested Capital: Formula, Analysis, Examples
Return on Invested Capital (ROIC) has emerged as a critical metric for evaluating a company’s profitability and efficiency in utilising its capital. This performance indicator has gained significant attention from investors, analysts, and corporate decision-makers alike, as it provides valuable insights into a business’s ability to generate returns relative to the capital it has invested.
Article Contents
- What is Return on Invested Capital?
- Formula for Calculating ROIC
- Adjustments to the ROIC Formula
- Interpreting Capital Allocation and ROIC in Finance
- Factors Influencing ROIC
- Limitations or Drawbacks of ROIC
- ROIC vs ROCE
- ROIC vs Other Financial Metrics
- Integration with Valuation Models
- Examples and Case Studies for ROIC
- Strategies for Improving ROIC
- ROIC and Shareholder Value Creation
Key Takeaways
| Key Takeaway | Description |
| Definition and Importance |
|
| Formula and Calculation |
|
| Interpretation |
|
| Influencing Factors |
|
| Limitations |
|
| Comparison with Other Metrics |
|
| Integration with Valuation Models |
|
| Strategies for Improvement |
|
| Relation to Shareholder Value |
|
What is Return on Invested Capital?
Return on Invested Capital (ROIC) is a financial ratio that evaluates a company’s ability to generate returns from the capital it has invested in its operations. It considers both debt and equity capital, providing a comprehensive view of a business’s profitability relative to the total capital employed. ROIC is a crucial metric for investors, as it helps them assess a company’s ability to create value and generate returns on their investment.
Formula for Calculating ROIC
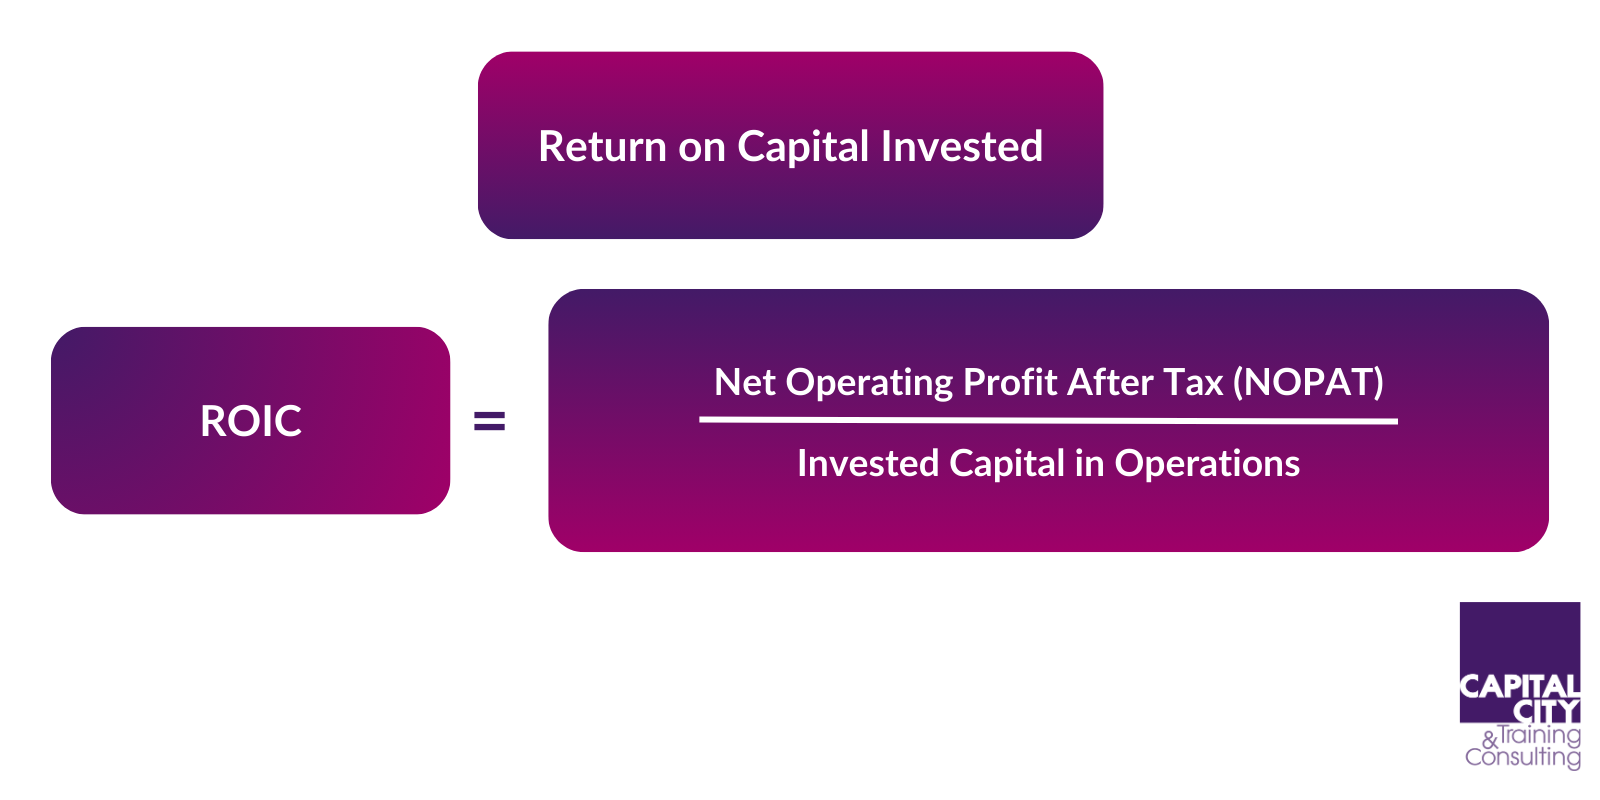
The formula for calculating ROIC is as follows:
ROIC = Net Operating Profit After Tax (NOPAT) / Invested Capital in operations
Where:
- Net Operating Profit After Tax (NOPAT) = Operating Profit × (1 – Tax Rate)
- Invested Capital = Total Debt + Total Equity – Excess Cash (i.e. Net Debt + Equity) less any non-operating assets.
- See the example at the foot of this blog.
To calculate ROIC, the first step is to determine the Net Operating Profit After Tax (NOPAT), which represents the company’s operating profit after accounting for taxes. This figure is then divided by the Invested Capital, which includes both debt and equity capital employed in the business, minus any excess cash or investments not directly utilized in operations.
Adjustments to the ROIC Formula
While the basic ROIC formula is widely accepted, analysts and companies may make adjustments or modifications to better suit their specific needs or to address potential distortions. Common adjustments include:
Eliminating capital invested in non-operating assets (as stated in the formula above): Companies may invest capital in assets that do not generate operating profit. In particular, investments. These contribute to overall profit, but not operating profit (they give finance income, not operating income). In our opinion, this always gives a more ‘pure’ ROIC and should always be done.
- Operating Leases: Companies with significant operating leases may adjust the invested capital figure to account for the present value of future lease obligations, providing a more accurate representation of the capital employed.
- Capitalization of Expenses: Certain expenses, such as research and development (R&D) or advertising, may be capitalized and amortized over their useful life, rather than expensed immediately. This can impact the NOPAT and invested capital calculations.
- Off-Balance Sheet Items: Analysts may adjust for off-balance sheet items, such as contingent liabilities or operating leases, to provide a more comprehensive view of the capital invested.
- Cash Adjustments: In addition to excluding excess cash, some analysts may adjust for cash flow deficits or surpluses to better reflect the actual capital requirements of the business.
- Industry-Specific Adjustments: Certain industries may require specific adjustments to the ROIC formula to account for unique aspects of their operations or capital structures.
Interpreting Capital Allocation and ROIC in Finance
ROIC provides valuable insights into a company’s capital allocation strategies and overall profitability. A high ROIC indicates that a business is effectively utilizing its capital resources to generate substantial returns, suggesting efficient capital allocation and strong operational performance. Conversely, a low ROIC may signal inefficient capital deployment, operational challenges, or intense competition within the industry.
Investors and analysts often use ROIC as a benchmark to compare companies within the same industry or sector, as it helps identify businesses that are outperforming their peers in terms of capital efficiency and profitability. Additionally, tracking ROIC over time can reveal trends and patterns in a company’s performance, allowing stakeholders to make informed decisions about their investments.
Factors Influencing ROIC
Several factors can influence a company’s ROIC, including:
- Operating Efficiency: Companies with streamlined operations, effective cost management, and efficient utilization of resources tend to have higher ROIC values.
- Asset Utilization: Businesses that maximize the productivity of their assets, such as machinery, equipment, and inventory, are likely to generate higher returns on their invested capital.
- Leverage: The level of debt financing utilized by a company can impact its ROIC. While leverage can potentially boost returns, excessive debt can increase financial risk and strain cash flows.
- Industry Dynamics: The nature of the industry, competitive landscape, and economic conditions can significantly affect a company’s ability to generate returns on its invested capital.
- Growth Opportunities: Companies with attractive growth prospects and the ability to reinvest capital effectively may experience higher ROIC over time.
Limitations or Drawbacks of ROIC
While ROIC is a valuable metric, it is important to acknowledge its limitations and potential drawbacks: #
- Accounting Considerations: The calculation of ROIC relies on financial statements, which are subject to accounting principles and methods that can vary across companies and industries. This can impact the comparability of ROIC figures.
- Historical Measure: ROIC is a historical measure and may not always predict future performance, especially in rapidly changing industries or during economic disruptions.
- Capital Intensity: ROIC may favor companies with lower capital requirements, as it is easier for them to generate higher returns on invested capital. Capital-intensive businesses may struggle to achieve high ROIC levels, even if they are efficient operators.
- Growth Considerations: Companies reinvesting heavily in growth initiatives may have lower ROIC in the short term, but this may not reflect their long-term potential.
- Industry Dynamics: Certain industries may inherently have lower or higher ROIC due to factors such as competition, regulation, and barriers to entry, making cross-industry comparisons less meaningful.
ROIC vs ROCE
While ROIC and Return on Capital Employed (ROCE) are similar concepts, they differ in their calculation methodologies. ROIC is adjusted for tax. It is calculated using Net Operating Proft * (1-tax rate). ROCE is calculated using pure Operating Profit. For investors ROIC is a better indicator, therefore, of returns on capital.
ROIC vs Other Financial Metrics
While ROIC is a valuable metric, it should be analysed in conjunction with other financial ratios and indicators to gain a comprehensive understanding of a company’s performance. Some commonly used metrics include:
- Return on Equity (ROE): Measures a company’s profitability relative to its shareholders’ equity.
- Return on Assets (ROA): Evaluates a company’s ability to generate profits from its assets.
- Earnings Before Interest, Taxes, Depreciation, and Amortization (EBITDA): Provides insight into a company’s operating cash flow and profitability.
- Price-to-Earnings (P/E) Ratio: Indicates the market’s valuation of a company’s stock relative to its earnings.
Integration with Valuation Models
ROIC is a key input in various valuation models used to determine a company’s intrinsic value. Here’s how ROIC is integrated with some common valuation approaches:
- Discounted Cash Flow (DCF) Analysis: In DCF models, ROIC is used to estimate a company’s future growth potential and cash flow generation. Companies with higher ROIC are often assumed to have better prospects for reinvesting capital at higher rates of return, leading to higher projected cash flows and valuations.
- Residual Income Models: Residual income models, such as the Residual Income Valuation (RIV) model, use ROIC as a key input to calculate the value created by a company’s ability to generate returns above its cost of capital. Higher ROIC levels result in higher valuations under these models.
- Economic Value Added (EVA) Analysis: EVA is a performance metric that measures the value created by a company relative to the cost of capital employed. ROIC is a crucial component in calculating EVA, as it represents the rate of return generated on invested capital.
- Valuation Multiples: While not directly integrated into valuation models, ROIC is often used in conjunction with valuation multiples, such as EV/EBITDA or P/E ratios, to assess whether a company’s valuation is justified by its profitability and capital efficiency.
By incorporating ROIC into valuation models, analysts and investors can better estimate a company’s future performance, growth prospects, and ultimately, its intrinsic value.
Examples and Case Studies for ROIC
To illustrate the practical application of ROIC, let’s consider a few examples and case studies:
Example 1:
Company A and Company B operate in the same industry. Company A has an ROIC of 18%, while Company B’s ROIC is 12%. Based on this information, an investor might conclude that Company A is more efficient in utilizing its capital and generating higher returns, making it a potentially more attractive investment opportunity within the same industry.
Case Study 1: Apple Inc.
Apple Inc., the tech giant known for its innovative products and services, has consistently maintained a high ROIC over the years. In its fiscal year 2022, Apple reported an ROIC of 33.7%, indicating its exceptional ability to generate returns on the capital invested in its operations. This impressive ROIC can be attributed to factors such as strong brand recognition, effective supply chain management, and a loyal customer base.
Case Study 2: Amazon.com, Inc.
Amazon.com, Inc., the e-commerce behemoth, has historically reinvested a significant portion of its profits into growth initiatives, such as expanding its logistics network and cloud computing services. While this strategy has resulted in a lower ROIC compared to some of its peers, it has enabled Amazon to capture market share and position itself for long-term growth. In its fiscal year 2022, Amazon reported an ROIC of 11.5%, reflecting its focus on reinvesting in future growth opportunities.
Strategies for Improving ROIC
Companies seeking to improve their ROIC can employ various strategies, such as:
- Cost Reduction: Streamlining operations, optimizing supply chains, and implementing cost-saving measures can help reduce expenses and improve profitability, ultimately boosting ROIC.
- Asset Optimization: Efficiently utilizing assets, such as machinery, equipment, and inventory, can lead to higher returns on invested capital. Companies can explore initiatives like lean manufacturing, just-in-time inventory management, and asset sharing to maximize asset productivity.
- Revenue Growth: Increasing revenue through market expansion, product innovation, or pricing strategies can contribute to higher ROIC, provided the additional revenue is generated efficiently without a disproportionate increase in invested capital.
- Divestment of Underperforming Assets: Identifying and divesting assets or business segments that generate low returns can help companies allocate capital more effectively and improve overall ROIC.
- Capital Structure Optimization: Striking the right balance between debt and equity financing can help companies minimize their cost of capital and enhance ROIC. However, it is essential to maintain a sustainable level of leverage to avoid excessive financial risk.
ROIC and Shareholder Value Creation
ROIC is closely linked to shareholder value creation, as companies with consistently high ROIC tend to generate superior returns for investors over the long term. When a company’s ROIC exceeds its cost of capital, it indicates that the business is creating value by generating returns above the required rate of return demanded by investors.
Investors often seek companies with a track record of high and stable ROIC, as these businesses are more likely to deliver strong shareholder returns through a combination of capital appreciation and dividend growth. Additionally, companies with high ROIC are better positioned to reinvest their profits in value-creating projects, further enhancing their growth prospects and shareholder value.
Return on Capital Invested (ROIC) is a powerful financial metric that provides insights into a company’s profitability and efficiency in utilizing its capital resources. By analyzing ROIC, investors and analysts can assess a business’s capital allocation strategies, identify industry outperformers, and make informed investment decisions. However, it is crucial to consider ROIC in conjunction with other financial ratios and industry-specific factors to gain a comprehensive understanding of a company’s performance and prospects. Companies can strive to improve their ROIC through cost reduction, asset optimization, revenue growth, and capital structure optimization, ultimately driving shareholder value creation.

ROIC FAQs
To calculate ROIC in Excel, you can use the following illustration:
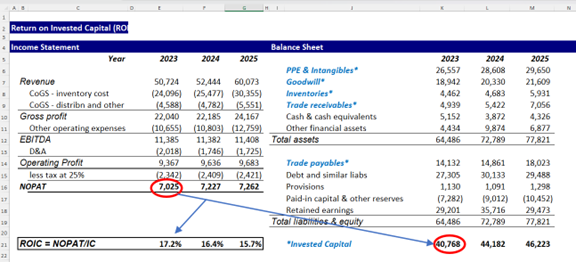
Here, you can see the relevant financial information extracted from a set of company financial statements. Note: the Invested Capital includes only the operating assets, net of the operating payables (labelled in blue). Cash does not generate an operating income – so it’s not included as capital invested in operating assets.