Return on Capital Employed (ROCE): Formula, Analysis, and Examples
The fundamental question here is: how do we assess a company’s success? It may be as simple as looking at growing revenues and market share. But profit has to come into question, not just revenue. Investors need a return, and that comes from profit. But which profit? Operating profit, for example, or Net income, or Profit before tax?
One of the key metrics used to evaluate a business’s efficiency in generating profits from its capital investments is Return on Capital Employed (ROCE). This measure provides valuable insights into a company’s ability to effectively utilise its resources and create value for investors.
Article Contents
- What is ROCE?
- Formula for Calculating ROCE
- Interpreting ROCE in Finance
- What’s the Difference Between ROCE and ROIC?
- Industry Trends for ROCE
- How Businesses Improve Return On Capital Employed
- ROCE Case Studies and Examples
- Differences Between ROCE and Other Profitability Ratios
- Limitations of ROCE
- Using ROCE to Compare Companies Across Industries
- Factors Affecting ROCE Fluctuations
Key Takeaways
| Topic | Key Takeaways |
| Definition of ROCE | Financial ratio measuring a company’s profitability relative to capital invested. Reflects how well a business uses its employed capital (equity and debt) to generate operating profits. |
| Formula |
|
| Interpretation | Higher ROCE indicates more efficient capital allocation and better returns. Should be evaluated in context of industry and compared to peers and historical trends. Ideally should be higher than the company’s cost of capital. |
| Importance | Key performance measure for professional investors and company management. Helps assess a company’s efficiency in utilizing resources and creating value. |
| Comparison to Other Metrics | Similar to Return on Invested Capital (ROIC), but ROIC is post-tax. Differs from ROE and ROA by considering both equity and debt financing. |
| Industry Trends | Service industries tend to have higher ROCE due to lower capital requirements. Capital-intensive industries (e.g., manufacturing, utilities) typically have lower ROCE. |
| Strategies to Improve ROCE | Increase operating profitability, optimize asset utilization, rationalize capital expenditures, improve working capital management, consider strategic acquisitions or divestments. |
| Limitations | Calculation can be inconsistent across companies, may encourage short-term thinking, difficult to compare across industries, does not account for risk. |
| Factors Affecting ROCE | Changes in operating profitability, capital expenditures, acquisitions or divestments, economic conditions, accounting policy changes. |
What is ROCE?
Return on Capital Employed (ROCE) is a financial ratio that measures a company’s profitability, taking into account how much capital has been invested to generate the profit. Think of it as a return on investment – just like earning interest on a bank account with cash invested, but investing in business assets instead. It reflects how well a business is using its employed capital – equity and debt – to generate operating profits. Two comparable companies may be equally profitable, but surely the better investment is the one that is more efficient with its allocation of capital – meaning same return on a lower investment: it’s more efficient. A higher ROCE generally indicates that a company is efficient in allocating its capital and generating returns.
Formula for Calculating ROCE
The formula for calculating ROCE is as follows:
ROCE = Operating Profit / Capital Employed
Where:
- Operating Profit = Earnings Before Interest and Taxes (EBIT)
- Capital Employed = Investment in Net Operating Assets (in a non-complex business this means Equity + Net Debt)
To calculate ROCE, you first need to determine the company’s operating profit, which is typically represented by Earnings Before Interest and Taxes (EBIT). This figure represents the company’s earnings from its core operations, excluding the effects of financing (interest) and taxes.
Next, you need to calculate the capital employed, which is the sum of a company’s equity and net debt (borrowed money, net of cash). But why net of cash? It may be simpler to look at this from the ‘other side’ of the balance sheet. Look at this diagram below, representing a company’s balance sheet.
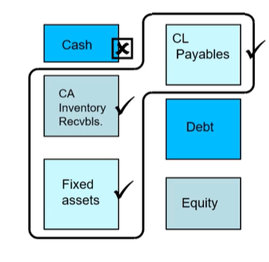
If you were to take over a business to run it yourself, what would you need to take over to keep the business running? What would be the investment? In short, you would need to buy the net Working Assets (that is Inventory, receivables, net of payables) PLUS the fixed assets (property, manufacturing plant, machinery etc. ). You would not need to take cash. Cash is needed to keep the business ticking over, but this could be covered by a bank RCF or overdraft (debt). It is a ‘nice to have’ rather than a ‘need to have’ and contributes nothing to operating profit (EBIT). If it contributes nothing to EBIT it should not be included in operating assets.
So, in summary, you’d need to invest in Net Working Assets plus Fixed Assets. As the balance sheet is an ‘equation’ then this is the same as Debt – Cash + Equity, or Net Debt + Equity.
Interpreting ROCE in Finance
So, now we know ROCE is a ‘return on investment’ measure, you may ask how popular it is as a metric for professional investors and company management. ROCE is absolutely one of the key performance measures used. It is a valuable metric for investors, analysts, and management teams to assess a company’s performance and efficiency in utilising its capital. A higher ROCE generally indicates that a company is generating higher returns for every unit of capital invested, which must be desirable as an investor / shareholder.
When looking at individual projects, management should rationally only consider projects where the return is greater than the cost of funding the project. At the company level, this means ROCE is greater than WACC.
However, it’s important to note that ROCE should be evaluated within the context of the industry and compared to peers and historical trends. A good ROCE will come from either industries that are less capital intensive, or companies within a sector that are utilising their capital more efficiently.
Different industries have varying capital requirements and profitability levels, which can affect the interpretation of ROCE. For example, a ROCE of 15% may be considered excellent for a capital-intensive industry like manufacturing, while it may be considered average or even low for a service-based industry with lower capital requirements.
When interpreting ROCE, it’s essential to consider the following factors:
- Industry Benchmarks: Compare a company’s ROCE to its industry peers to gauge its relative performance. Industries with higher capital requirements, such as manufacturing or utilities, tend to have lower ROCE compared to service-based industries.
- Trend Analysis: Evaluate a company’s ROCE over time to identify trends and potential areas of improvement or concern. A consistently increasing or decreasing ROCE can indicate changes in a company’s operational efficiency or capital allocation strategies.
- Cost of Capital: A company’s ROCE should ideally be higher than its cost of capital (weighted average cost of debt and equity) to create value for shareholders. If ROCE is lower than the cost of capital, it may indicate inefficient use of capital or potential issues with profitability.
- Asset Utilisation and Dupont Analysis: Breaking down ROCE into component parts can add some insight as to why the ROCE is different to benchmark (prior years or peers). The fundamental components of ROCE are operating profit margin and asset turnover ratio:
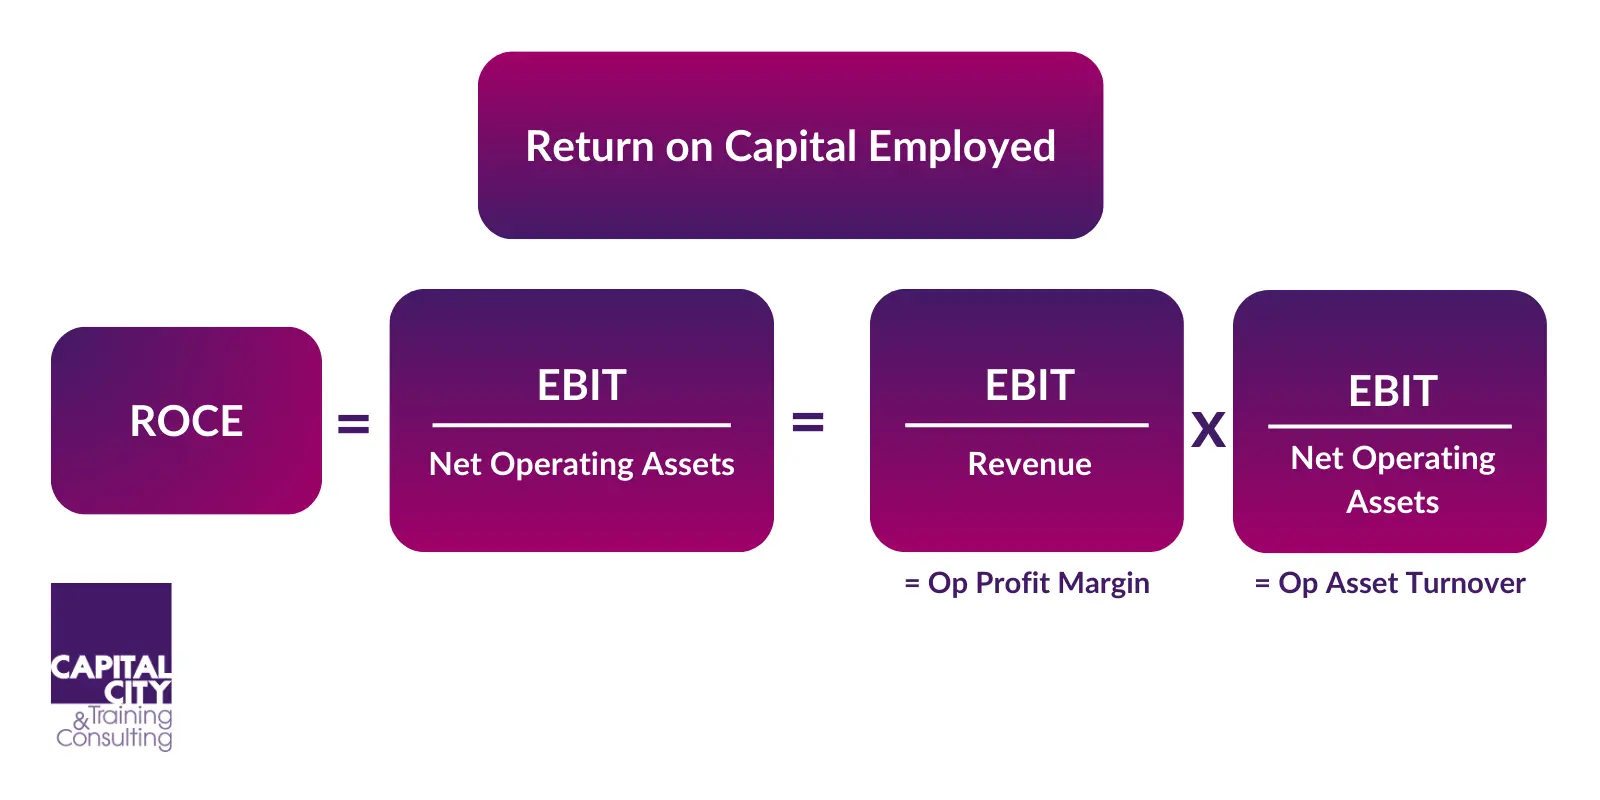
This breakdown into Profitability and Capital Efficiency can help to identify areas for improvement. A low ROCE could be due to low profitability (low operating profit margin) or inefficient asset utilisation (low asset turnover ratio). Does the company have a low profit margin, or is it that the assets do not generate sufficient revenue?
What’s the Difference Between ROCE and ROIC?
A similar metric used by investors and management is the Return on Invested Capital – which is essentially Return on Capital post tax:
RoIC = EBIT * (1-tax rate) / Capital Employed
= NOPAT / Capital Employed
Where:
- NOPAT is Net Operating Profit after Tax
This makes some good sense too, in that WACC is a measure of net of tax, so the return should be measured on a consistent basis.
While ROCE and Return on Invested Capital (ROIC) are similar concepts, there is a subtle difference between the two. ROIC considers only the invested capital, which excludes excess non-operating assets. ROCE, some might say, includes all assets, regardless of their source or purpose, but we would always recommend excluding investment in ‘non-core’ or ‘non-operating assets’ such as other investments that do not contribute to a company’s operating profit.
In general, ROIC is considered a more precise measure of a company’s ability to generate returns on the capital directly related to its core operations. However, ROCE is still widely used and provides a more comprehensive view of a company’s overall capital efficiency.
Common Challenges When Performing a DCF Analysis
Determining an appropriate discount rate is often cited as one of the most complex aspects of DCF analysis. The discount rate is essentially the cost of capital, which reflects the expected return required by investors. Determining this rate involves:
- Risk-Free Rate: This is usually the yield on government bonds and represents the long-term return expected from a completely risk-free investment.
- Beta: This is the relative volatility of a stock versus the market. This is used as the measure of how much riskier the investment is compared to the broader market. Beta is used to adjust the discount rate to reflect risk.
- Market Risk Premium: Calculated as the expected return of the market minus the risk-free rate, it represents the additional average long-term return required by investors for taking on the extra risk of investing in the market.
- After-tax Cost of Debt: Represents the yield at which the company would expect to pay on new debt raised today. This is often synthesised by looking at current government bond yields and applying an appropriate credit spread. TO give the after-tax cost, the debt yield is discounted at the tax rate. So the formula is After tax cost of debt (Kd)= Yield*(1-tax rate).
A basic formula to calculate the discount rate (for use in DCF) might be:
Ke = Cost of Equity = Risk-Free Rate + (Beta x Market Risk Premium)
The Cost of Capital (WACC) is given by the formula:
WACC = Equity/EV*Ke +Net debt/EV*Kd
Accurately estimating future cash flows is also complex. Analysts must make assumptions about future performance and growth rates. An alternative to the perpetuity method for Terminal value is to use an exit multiple after 5 years. This again is subjective. All these different factors can significantly impact the DCF valuation. It’s beneficial to employ various scenarios and sensitivity analyses to understand the range of possible outcomes and intrinsic risks.
As an equity analyst, rather than making our own assumptions, we can use a DCF model to ask the question “what has to be true for the current share price to be correct?” This can give us a very useful insight into the cheapness/expensiveness of a share.
Industry Trends for ROCE
ROCE can vary significantly across industries due to differences in capital requirements, profitability levels, and operational characteristics. Here are some general industry trends for ROCE:
- Service Industries: Industries with low capital requirements, such as consulting, software, and financial services, tend to have higher ROCE compared to capital-intensive industries.
- Manufacturing: Capital-intensive industries like automotive, machinery, and consumer goods typically have lower ROCE due to higher capital investments in fixed assets like factories and equipment.
- Retail: The retail industry generally has a moderate ROCE, as it requires significant investments in inventory, stores, and other assets.
- Utilities: Utilities, such as energy and water companies, tend to have lower ROCE due to the capital-intensive nature of their operations and regulated environments.
It’s important to note that these are general trends, and individual companies within an industry may exhibit different ROCE levels based on their specific strategies, operational efficiencies, and capital allocation decisions.
How Businesses Improve Return On Capital Employed
Companies can implement various strategies to improve their Return on Capital Employed (ROCE). Here are some common approaches:
- Increase Operating Profitability: Businesses can focus on improving their operating profit margins by optimising costs, increasing operational efficiencies, and enhancing revenue streams through product innovation, pricing strategies, or market expansion.
- Optimise Asset Utilisation: Efficient asset utilisation is crucial for improving ROCE. Companies can review their asset base and divest or redeploy underutilised or non-core assets, streamline inventory management, and implement lean manufacturing practices to improve asset turnover.
- Rationalise Capital Expenditures: Businesses can critically evaluate their capital expenditure plans and prioritise investments that offer higher returns on capital employed. This may involve deferring or cancelling low-return projects and focusing on high-return initiatives.
- Improve Working Capital Management: Effective working capital management can free up capital employed and improve ROCE. Companies can optimise inventory levels, reduce receivables collection periods, and extend payables terms to better manage their working capital cycle.
- Strategic Acquisitions or Divestments: Companies may consider acquiring businesses or assets with higher ROCE potential or divesting underperforming or non-core assets to improve their overall ROCE.
- Leverage Operational Improvements: Continuous improvement initiatives, such as lean manufacturing, process optimisation, and supply chain enhancements, can contribute to better asset utilisation and increased profitability, ultimately boosting ROCE.
It’s important to note that improving ROCE may require a combination of these strategies and should be aligned with the company’s overall business objectives and long-term growth plans.
ROCE Case Studies and Examples
To better understand the practical application of ROCE, let’s consider some case studies and examples:
Apple Inc.
Apple is known for its capital-efficient business model, with a strong focus on research and development and asset-light operations. In 2022, Apple reported a ROCE of approximately 38%, significantly higher than the industry average. This reflects the company’s ability to generate substantial profits while maintaining a lean asset base, primarily through its innovative product designs and efficient supply chain management.
Walmart Inc.
As a retail giant, Walmart operates in a capital-intensive industry with substantial investments in stores, distribution centres, and inventory. Despite these capital requirements, Walmart has maintained a ROCE of around 13% in recent years, which is considered healthy for the retail sector. The company’s strong operational efficiencies, supply chain optimisation, and effective inventory management contribute to its impressive ROCE.
General Electric (GE)
GE, a diversified industrial conglomerate, has faced challenges in recent years due to its complex business structure and capital-intensive operations. In 2018, GE’s ROCE fell to around 4%, well below the company’s target and industry averages. This low ROCE prompted GE to undergo a significant restructuring, divesting non-core businesses and refocusing on its core industrial operations to improve capital efficiency and profitability.
Amazon.com Inc.
Amazon, the e-commerce giant, has historically operated with a low ROCE due to its strategy of reinvesting profits into growth initiatives and expanding its infrastructure. However, as the company has matured and focused on improving profitability, its ROCE has steadily increased, reaching around 18% in 2022. This improvement reflects Amazon’s ability to leverage its scale, optimise its logistics network, and generate higher margins from its diversified business segments, including cloud computing and advertising.
These case studies demonstrate how ROCE can vary across industries and companies, and how businesses can implement strategies to improve their ROCE and overall capital efficiency.
Differences Between ROCE and Other Profitability Ratios
While ROCE is a valuable profitability metric, it is important to understand how it differs from other commonly used ratios:
- Return on Equity (ROE): ROE measures a company’s profitability in relation to the equity capital invested by shareholders. It focuses solely on the return to equity holders, excluding debt financing. ROE is calculated as Net Income / Shareholders’ Equity.
- Return on Assets (ROA): ROA measures a company’s profitability relative to its total assets. It assesses how efficiently a company generates earnings from its assets, regardless of the financing source. ROA is calculated as Net Income / Total Assets.
The key difference between ROCE and these ratios is that ROCE considers both equity and debt financing in its calculation, providing a more comprehensive view of a company’s capital efficiency. ROE and ROA, on the other hand, focus on specific aspects of a company’s financial structure.
Limitations of ROCE
While ROCE is a useful metric, it has some limitations that should be considered:
- Inconsistent Calculation: The calculation of ROCE can vary across companies due to differences in accounting practices, such as the treatment of operating leases or the classification of certain items as operating or non-operating.
- Short-term Focus: ROCE may encourage short-term thinking, as companies may be tempted to defer long-term investments or cut costs to boost short-term profitability at the expense of long-term growth.
- Industry Differences: As mentioned earlier, ROCE can vary significantly across industries due to differences in capital requirements and profitability levels. Comparing ROCE across industries may not provide meaningful insights without considering industry-specific factors.
- Ignores Risk: ROCE does not account for the risk associated with a company’s operations or investments. A high ROCE may be achieved by taking on excessive risk, which is not captured by the metric.
Using ROCE to Compare Companies Across Industries
While ROCE can be a useful metric for comparing companies within the same industry, comparing ROCE across different industries requires careful consideration:
- Adjust for Industry Norms: When comparing companies across industries, it is important to benchmark their ROCE against the industry average or median. This helps identify whether a company’s ROCE is above or below the industry norm.
- Consider Capital Intensity: Industries with higher capital requirements, such as manufacturing or utilities, tend to have lower ROCE compared to service-based industries. When comparing companies across industries, it is important to consider the inherent differences in capital intensity.
- Analyse Trends: Instead of focusing on a single year’s ROCE, analyse the trend in ROCE over time for each company. This can provide insights into how companies are managing their capital efficiency and whether they are improving or deteriorating relative to their industry peers.
- Use Multiple Metrics: ROCE should not be used in isolation when comparing companies across industries. It is important to consider other profitability metrics, such as operating margin or return on assets, as well as qualitative factors like market position, competitive advantages, and growth prospects.
Factors Affecting ROCE Fluctuations
A company’s ROCE can fluctuate over time due to various factors:
- Changes in Operating Profitability: Fluctuations in a company’s operating profit margin, driven by changes in revenue or operating costs, can directly impact ROCE.
- Capital Expenditures: Significant investments in capital assets, such as property, plant, and equipment, can temporarily lower ROCE until the assets start generating returns.
- Acquisitions or Divestments: Acquiring or divesting businesses or assets can impact both the operating profit and capital employed, leading to changes in ROCE.
- Economic Conditions: Economic downturns or industry-specific challenges can affect a company’s profitability and asset utilisation, resulting in ROCE fluctuations.
- Accounting Policies: Changes in accounting policies, such as the treatment of operating leases or the valuation of inventory, can impact the calculation of ROCE.
It is important to analyse the underlying drivers of ROCE fluctuations to understand whether they are temporary or indicative of a more fundamental shift in a company’s capital efficiency.

ROCE FAQs

An experienced finance and training professional and Co-Founder of Capital City Training Ltd, Greg has a demonstrated history of working in the financial services sector and has a passion for sharing his knowledge and skills throughout the financial services sector. He has been partnering financial and corporate clients in designing and delivering applied financial programs that make an impact on business outcomes. Greg is skilled in accounting & financial analysis, derivatives and risk management, financial modelling, business valuation and corporate finance and has worked with the worlds leading financial institutions. A strong business development professional and a qualified accountant (ICAEW member), CFA Charterholder and Associate Member of the Association of Corporate Treasurers in the UK (ACT).