Let me start by saying that in financial analysis, valuation and modelling there is no substitute for knowing your numbers! This is no doubt the case when it comes to looking at PPE.
PPE is one of the core elements of any financial analysis. That link between investing in the business and growth in operating profit has for ever been a core part of modelling and valuation.
So when it comes to producing a financial forecast, why is it so fiddly?! It’s because PPE in the balance sheet just isn’t as simple as we are first told.
When we, as trainers, explain the flow of financial statements from the ground up, movements in PPE work as simply as “add Capex, less depreciation” and off you go!
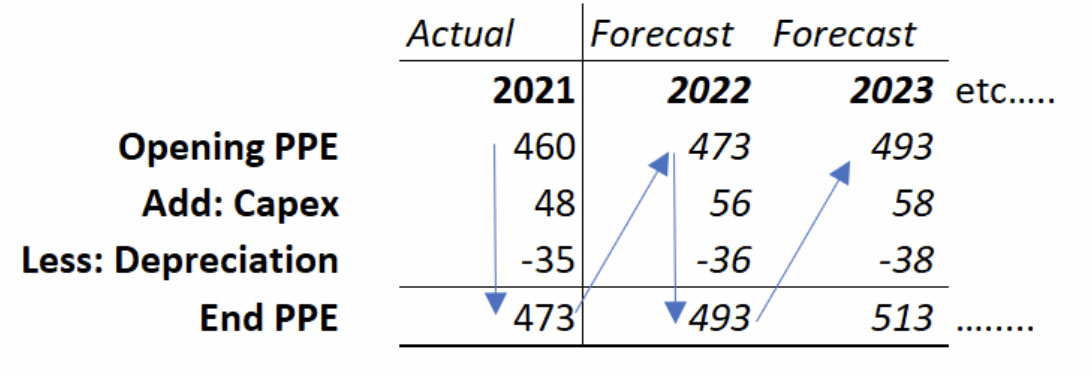
This simple ‘corkscrew’ working shows the method and simplicity. We simply estimate Capex based on historic patterns, and similarly for depreciation.

The problem comes in trying to reconcile and establish those historic patterns based on the Capex you can find in the published financials.
Firstly, note that the ‘Capex’ in the corkscrew working above must be net of any disposals. That’s not the problem. Look at these numbers for Unilever plc – one of our case-study companies we use in our modelling training.

For simplicity and speed, this is typically how a ‘first stab’ at the model would look. The sequence of building the historic data would be as above:
Opening balance + Net Capex from the cash flow statement – Depreciation = Closing PPE
But analysts then get caught up in the numbers not reconciling to the published financial statements. The negative Difference figure indicates that we are typically underestimating the PPE in our model. This is where knowing your numbers is of paramount importance – for your own sanity, but also for the credibility of the model. If the historics do not agree to published, how will anyone take the model seriously?
Quick Fix
One way to get a ‘complete’ sensible looking model is to work backwards from the published PPE balances. Get the opening and closing balances in place, take depreciation from the P&L notes, and then net Capex becomes the balancing figure. You cannot see the breakdown of net capex, but at least it’s complete and reconciles. When you have more timeyou can come back and pick it apart into its components. Your number will now look like this:

There. Doesn’t that look better? Well, in one way yes, but in other ways no! At the balances agree to published.
Better fix
The better fix is to get inside the numbers – something you should be confident to do. It will make forecasting simpler too. Many would look at the 2020 Capex above, note that it’s the first year of COVID and put it down to management nerves: deferring Capex. But NO. Although additions were down in 2020, they were not down that much!
Knowing your numbers will tell you that when you see investment / additions in PPE it can come from more places than just Capex in the cash flow statement, and there are other adjustments also hitting the numbers. Key things to consider:
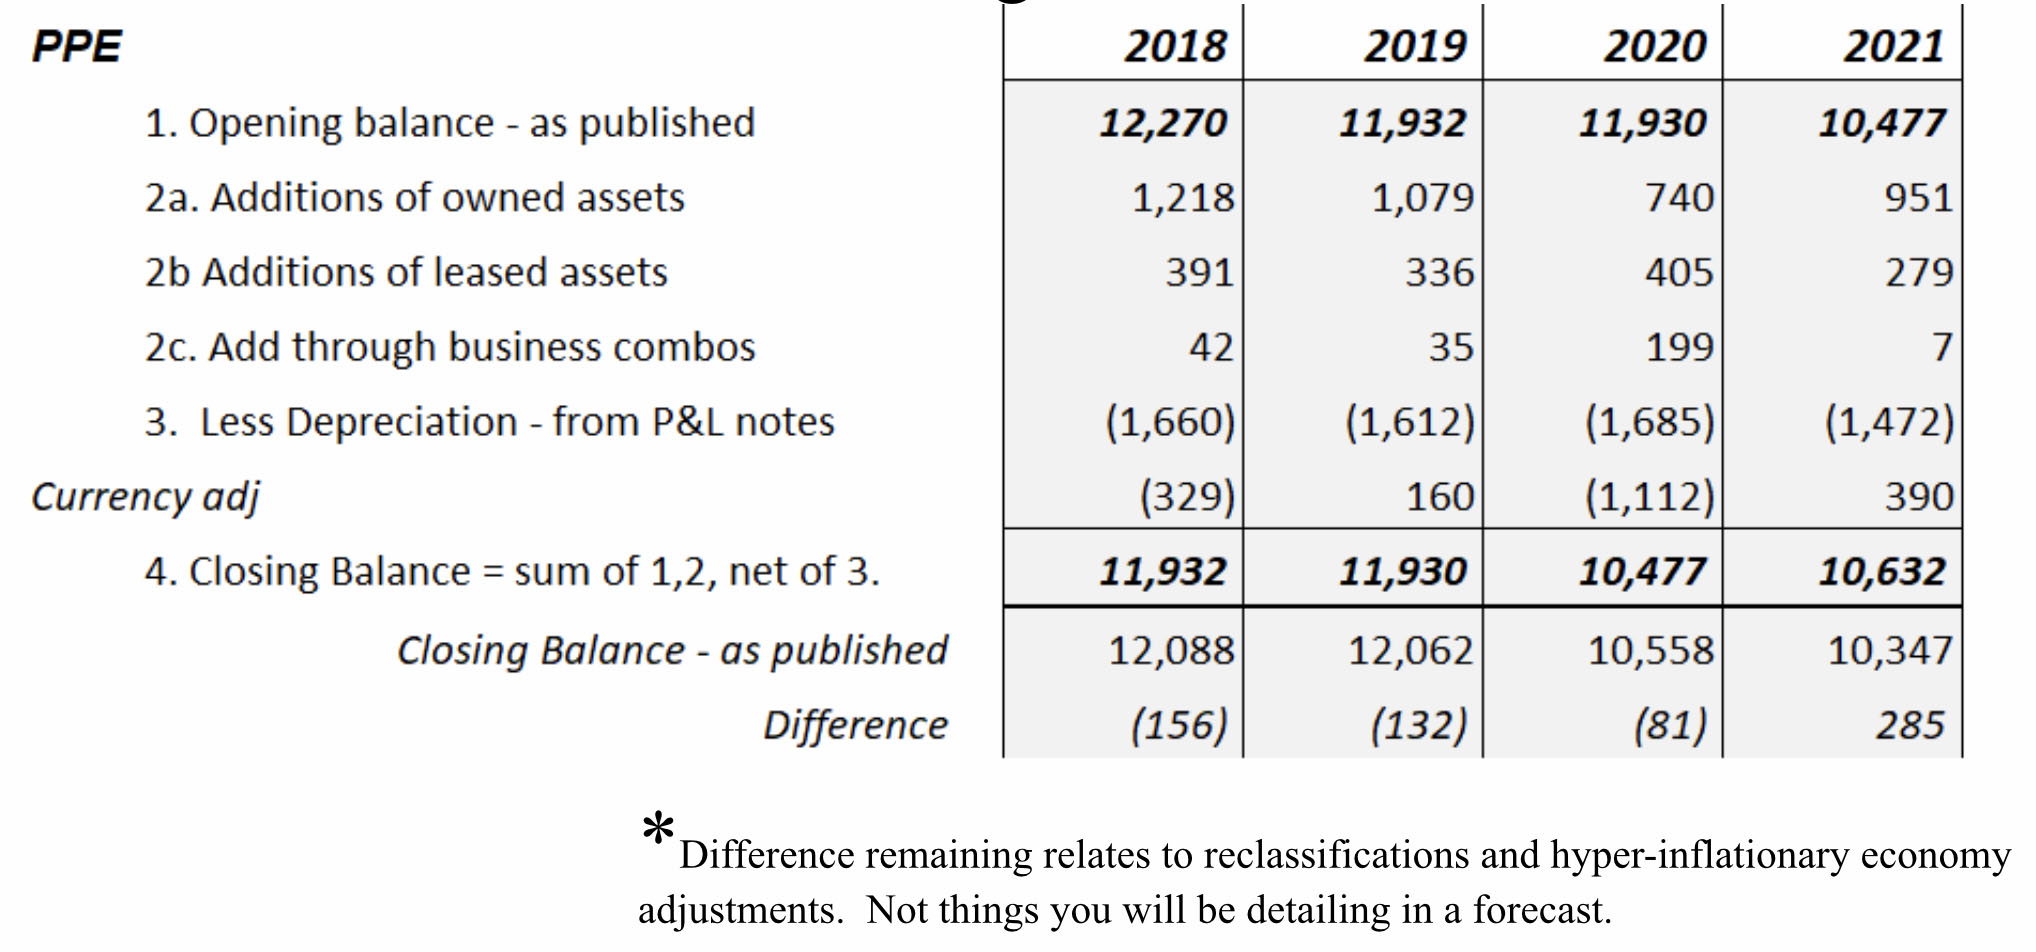
When we consider all this, we get to this breakdown:

Now this looks a lot more detailed – but it will make for better models! If you know your numbers it makes a lot more sense too.
For example, with the split of 2a and 2b, we can link 2a into the cash flow statement, and we can link 2b into a little Leased-asset working. With IFRS 16 having caused a lot ofdisruption to our models, the least we can do is put them right!
IFRS 16 is another can of worms, perhaps to be opened next time?……….


