Free Cash Flow (FCF): Formula, Analysis, Examples
There are numerous metrics and ratios used to evaluate a company’s financial performance and prospects. One such metric with significant importance is free cash flow (FCF). It serves as a valuable indicator of a company’s ability to generate cash and fund its growth initiatives, pay dividends, and reduce debt. Understanding free cash flow is crucial for investors, analysts, and business owners alike, as it provides insights into a company’s financial flexibility and long-term sustainability.
When someone refers to “Cash Flow” the question to ask is: which cash flow? It’s not a silly question as there are so many flavours to choose from. It does depend on what the number is to be used for but even then, there are choices to be made.
Do they mean EBITDA, Operating Cash Flows, Free Cash Flows, Free Cash Flows to the Firm or Free Cash Flows to Equity? Below we will discuss the main variations but also show you a full breakdown of each, side-by-side.
Article Contents
Key Takeaways
| Key Takeaway | Description |
| Definition | The amount of cash generated by a company, usually over a 1-year period, after allowing for commitments to cover operating expenses and capital expenditures needed to maintain and grow the business. |
| Types of FCF |
|
| Positive and High FCF | Viewed as a positive sign, indicating the company generates sufficient cash from operations to fund capital expenditures and have excess cash for debt repayment, dividends, or reinvestment. |
| Negative or Low FCF | A red flag, suggesting the company may be struggling to generate enough cash from operations to fund capital expenditures and other obligations, potentially leading to increased reliance on external financing. |
| EBITDA vs. FCF | EBITDA is often used as a proxy for operating cash flow but does not account for investments in working capital and capital expenditures, which can be critical for a business. |
| FCF Calculation |
|
| Importance of FCF | Provides insights into a company’s financial flexibility, ability to fund growth initiatives, service debt, and return value to shareholders. Crucial for valuations, investment decisions, and strategic initiatives. |
What is Free Cash Flow (FCF)?
Generally, free cash flow is the amount of cash generated by a company, usually over a 1-year period, after allowing for commitments to cover not just its operating expenses but also capital expenditures needed to maintain and grow the business.
This measure of cash gives investors an idea of what is ‘left over’ to pay off debt, distribute to shareholders through dividends or share buybacks, or to keep in cash / investments.
Types of FCF
Having said this, ‘free cash flow’ can have a different meaning to different people – so understanding what the number is intended to show is important! There are three main types of free cash flow:
- Free Cash Flow to the Firm (FCFF)
- Free Cash Flow to Equity (FCFE)
- Generic ‘Free Cash Flow’
Then there is EBITDA, seen as a proxy for operating cash flow, but certainly not the same.
Free Cash Flow to the Firm (FCFF)
Free cash flow to the firm (also known as Unlevered Free Cash Flow, or Free Cash Flow to the Enterprise) is a measure of the cash available to all providers of capital, including both debtholders and shareholders. It represents the cash generated by a company’s operations after accounting for investment in fixed assets (capital expenditure) and working assets (working capital, being inventory, receivables less trade payables).
It is also post-tax, but used in DCF valuation models this will be an adjusted tax figure based on EBIT rather than post-interest profit.
Free Cash Flow to Equity (FCFE)
Free cash flow to equity is free cash flows to the form, less the cash paid to service debt (both interest and capital repayments). It shows the cash generated that could be distributed to shareholders in the form of dividends or share buybacks. That doesn’t mean it will be distributed, but it is possible, assuming the company has sufficient retained earnings.
FCFE is particularly useful for valuing equity investments where debt is expected to be paid down (e.g. in a leveraged business) and assessing a company’s ability to return value to its shareholders.
Generic Free Cash Flow (FCF)
Generic free cash flow is a more general term that can refer to either FCFF or FCFE, depending on the context. It is often used when discussing free cash flow without specifying whether it is at the firm or equity level. It is normally taken as Operating Cash Flows (post tax) less Capex.
EBITDA
Earnings before interest, taxes, depreciation, and amortisation is one of the most widely quoted earnings indicators owing to its simplicity. It is the foundation of comparable company analysis and used in credit analysis as well as equity valuation. It is seen as the foundation for a company’s ability to generate cash by removing significant non-cash expenditure (depreciation of PPE and amortisation of intangible assets). The key thing it misses is the company’s investment in working capital (inventory, receivables, less payables)
When it is used in analysis, it is also typically ‘cleaned up’ to remove non-underlying or non-recurring items of income or expenditure. This makes it a better comparable, but also incomplete.
Formulae for Calculating FCF
Each type of Free Cash Flow is calculated as follow:
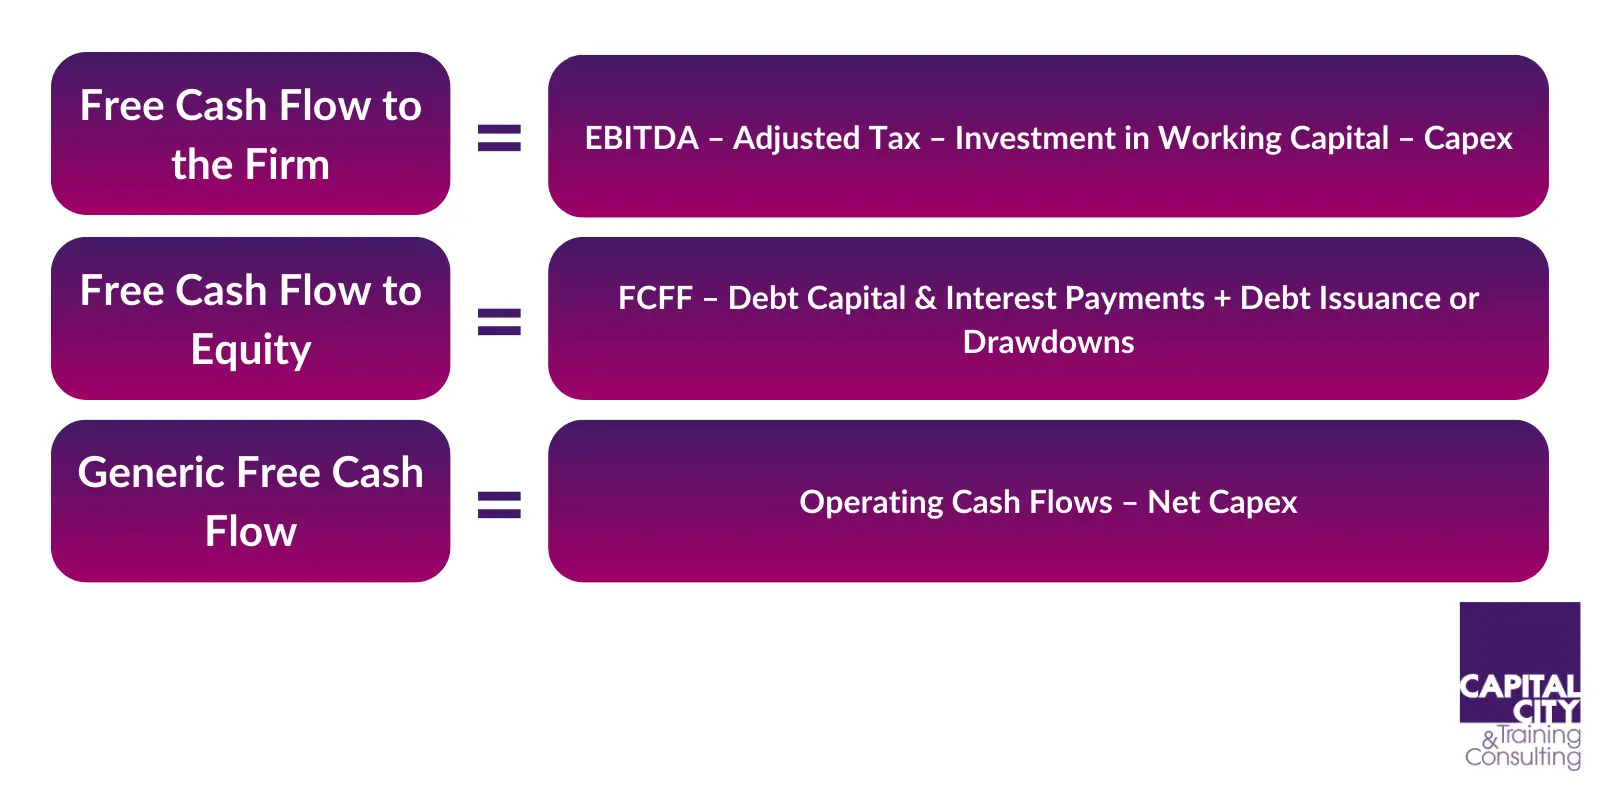
FCFF = EBITDA – adjusted tax – investment in working capital – Capex
FCFE = FCFF – debt capital and interest payments + debt issuance or drawdowns
Generic Free Cash Flow: FCF = Operating Cash Flows – net Capex (being Capex-cash from disposals of PPE

Interpreting Free Cash Flow in Finance
Positive and High FCF
A positive and high free cash flow is viewed as a positive sign for a company. It indicates that the company is generating sufficient cash from its operations to fund its capital expenditures and still have excess cash available for other purposes, such as debt repayment, dividend payments, or reinvestment in further growth opportunities.
Negative or Low FCF
On the other hand, a negative or low free cash flow can be a red flag, as it suggests that the company may be struggling to generate sufficient cash from its operations to fund its capital expenditures and other obligations. This could lead to an increased reliance on external financing, potentially putting the company at risk of financial distress.
EBITDA and Free Cash Flows
EBITDA is often taken as a proxy for operating cash flows and, although widely used, it is NOT necessarily a good proxy. Most importantly it makes no allowance for investments in operations – Capex or Working Capital – which can be critical to a business’ prospects and even survival.
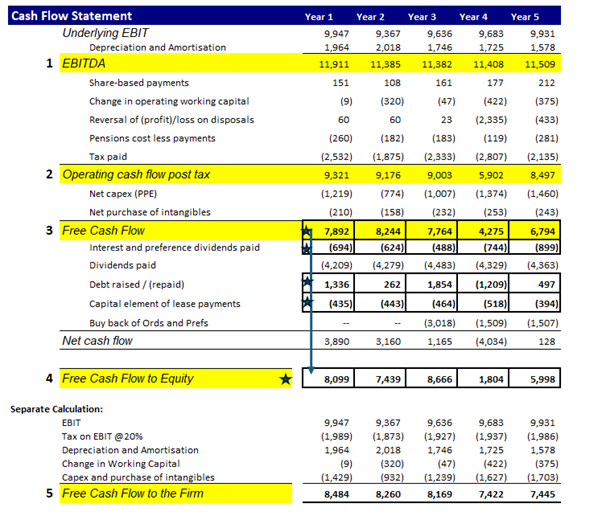
The best way to see the differences in calculations is through a side-by-side derivation of each type of cash flow and where EBITDA comes in.

Examples and Case Studies for Free Cash Flow
To better understand the practical application of free cash flow in finance, let’s consider a few examples and case studies:
Example 1: Apple Inc.
Apple Inc. is a prime example of a company with a consistently high free cash flow. In its fiscal year 2022, Apple reported an operating cash flow of $119.7 billion and capital expenditures of $11.6 billion. This resulted in a free cash flow of $108.1 billion. Apple’s strong free cash flow has allowed the company to invest heavily in research and development, pursue strategic acquisitions, and return significant value to shareholders through dividends and share buybacks.
Example 2: General Electric (GE)
General Electric (GE) has faced challenges in recent years, and its free cash flow has been a point of concern for investors. In 2018, GE reported a negative free cash flow of $4.5 billion, primarily due to restructuring costs and operational challenges in certain business units. This negative free cash flow raised concerns about the company’s ability to fund its operations, service its debt, and invest in future growth initiatives.
Case Study: Analysing Free Cash Flow in the Automotive Industry
The automotive industry is a capital-intensive sector, and free cash flow is a crucial metric for evaluating the financial health of car manufacturers. Companies like Ford and General Motors (GM) have faced significant challenges in recent years due to factors such as rising material costs, supply chain disruptions, and changing consumer preferences.
In 2022, Ford reported a free cash flow of $9.7 billion, while GM reported a free cash flow of $7.7 billion. These strong free cash flow figures have allowed both companies to invest in electric vehicle (EV) development, pursue strategic partnerships, and navigate the challenges posed by the COVID-19 pandemic and supply chain disruptions.
However, it’s important to note that free cash flow can fluctuate significantly from year to year, and a single year’s figure may not provide a complete picture of a company’s financial health. Analysts and investors often look at free cash flow over multiple years and consider it in conjunction with other financial metrics to gain a more comprehensive understanding of a company’s performance and prospects.

