Forecasting Methods in Budgeting and Modelling
Budgeting and modelling are integral components of financial planning and decision-making processes. Forecasting methods are employed to estimate future revenues, expenses, cash flows, and other financial metrics, enabling organisations to develop realistic budgets and create robust financial models. By accurately projecting future outcomes, businesses can optimise resource allocation, identify potential risks, and capitalise on emerging opportunities.
Article Contents
Key Takeaways
| Topic | Key Takeaways |
| Financial Forecasting |
|
| Types of Forecasting Models |
|
| Quantitative Methods |
|
| Qualitative Methods |
|
| Selecting the Right Method |
|
| Handling Conflicting Results |
|
What is Financial Forecasting?
Financial forecasting is the process of estimating future financial metrics based on historical data, current trends, and underlying assumptions. It involves analysing past patterns, taking into account external factors, and employing mathematical models or expert judgments to predict future outcomes. Effective financial forecasting aids in strategic decision-making, risk management, and performance evaluation, ultimately contributing to the overall success of an organisation.
Types of Forecasting Models
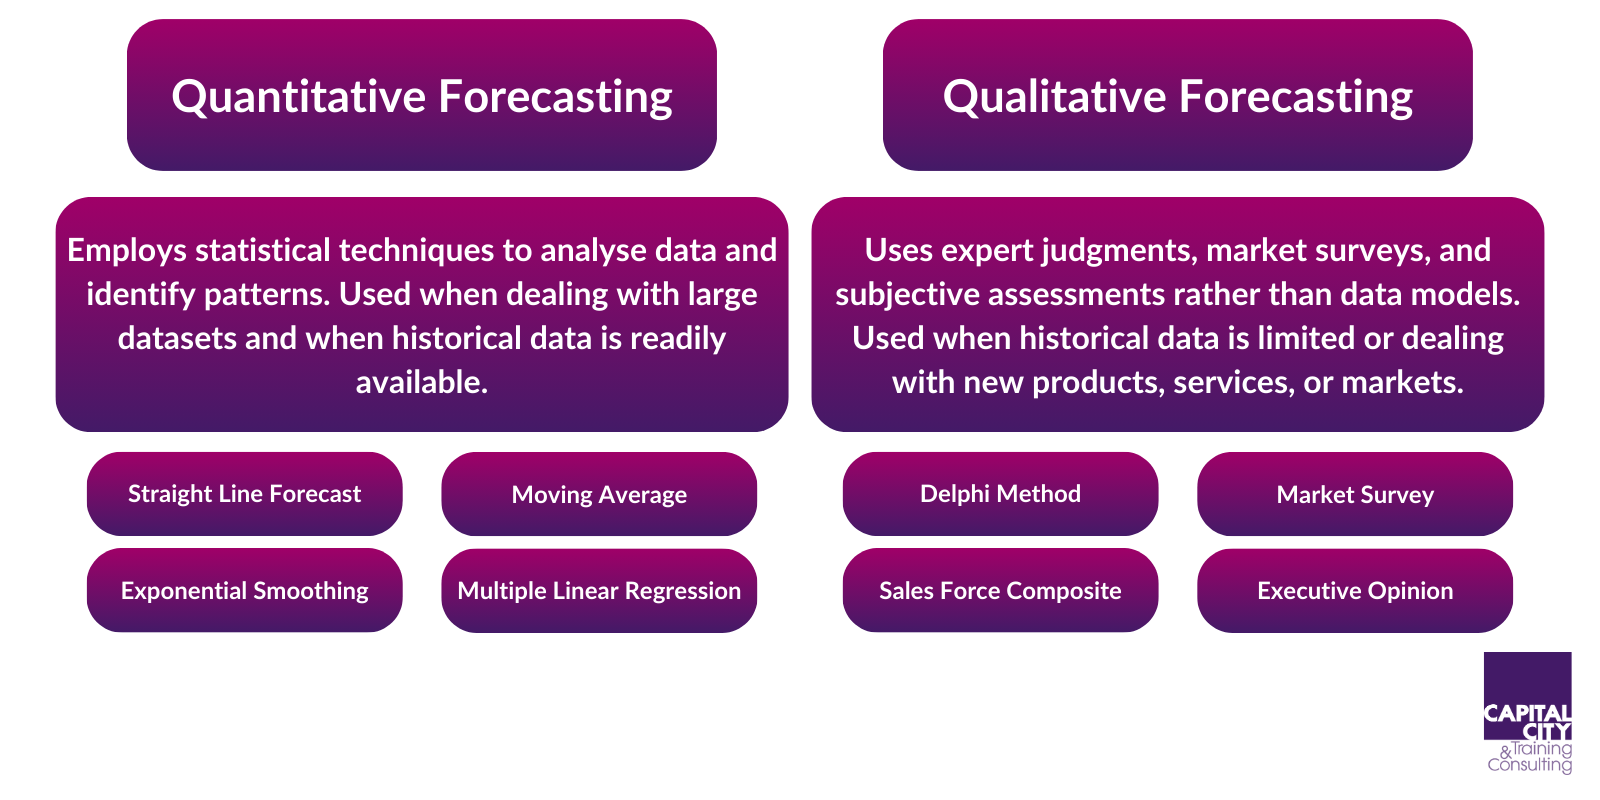
Forecasting models can be broadly categorised into two main categories: quantitative and qualitative. Quantitative forecasting methods rely on mathematical and statistical techniques, while qualitative methods incorporate expert opinions and market insights.
Quantitative Forecasting Methods
Quantitative forecasting methods are data-driven and employ statistical techniques to analyse historical data and identify patterns. These methods are particularly useful when dealing with large datasets and when historical data is readily available.
Straight-line Forecasting
The straight-line forecasting method, also known as the linear trend method, assumes that the historical data follows a linear pattern. This method uses regression analysis to fit a straight line to the data points, and future values are projected based on the linear equation. Straight-line forecasting is suitable for short-term forecasting and when the data exhibits a consistent linear trend.
Straight-line Forecasting in Excel
The great news is that you don’t need to be a stats genius to create this – Excel can do all the hard work. It uses Linear Regression analysis to find a ‘line of best fit’ to the data provided. Note that a linear fit may not be the best assumption – that is for you to decide!
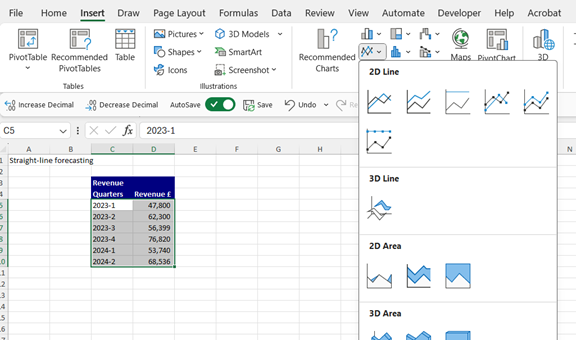
Take for example this set of Revenue data, and say we want to forecast the next 2 quarters using a linear trend:

To analyse this data in Excel, we would:
- Select the data
- Click on ‘Insert’ and select the Line Chart option as shown below. The line chart will pop up on the screen.
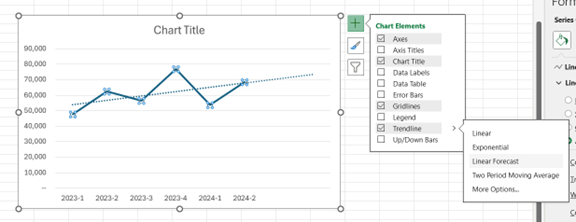
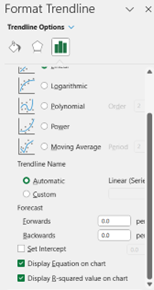
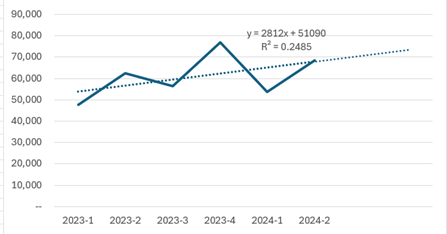
- Select the chart, click on the ‘+’ symbol next to the chart, select ‘Trendline’ then select ‘Linear Forecast. You will now see the trendline build out of the data, and see it extrapolated into future periods.
- You can choose ‘More Options’ from there and ask Excel to show you the equation behind the line of best fit, plus the R-Squared.
- Use the equation to create the forecast data for as many periods as you need.
Here is the forecast equation being used to compute data for 2024-Q3 through to 2025-Q2: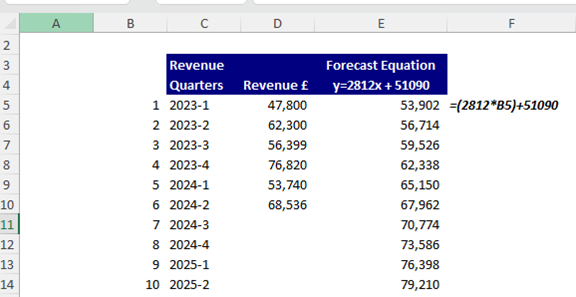
Moving Average
The moving average method smooths out fluctuations in data by calculating the average of a specific number of consecutive data points. This approach is useful when dealing with seasonal or cyclical data, as it helps identify underlying trends by removing random variations. Moving averages can be simple (equal weights) or weighted (assigning different weights to data points).
Exponential Smoothed Forecast in Excel
This is a great tool in Excel that will use a well-tested statistical technique called Exponential Smoothing. There is a function in Excel to do this FORECAST.ETS, but we will show you how to automate this with a chart.
Firstly, we have amended the time period labels so as not to confuse Excel – as per this:
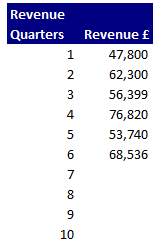
Note that “2023-1, 2023-2, 2023-2 etc……” for example, is now just “1,2,3….”
- Select the time counters and the data
- Go to the Data menu and click on the Forecast Sheet option:
- Select ‘Create’ and Excel will insert the results on a new sheet within your workbook.
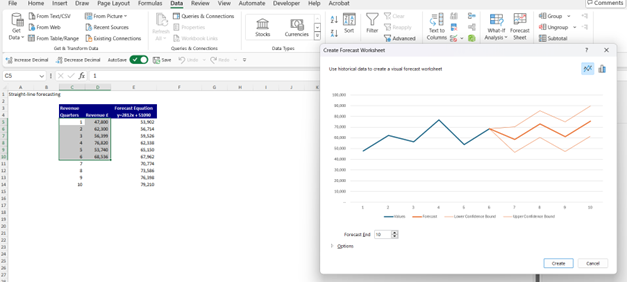
Based on a 95% confidence interval, Excel produces not only the ‘expected’ value forecast, but also the upper and lower 95% confidence forecasts – as shown in the 3 lines above.
On the sheet it creates, you also get all the numbers supporting the chart. You’ll look like a forecast genius in any presentation!
Multiple Linear Regression
Although we won’t show all the details here, Excel can also assist with Multiple Regression – where the output is a function of more than one factor. We have onle created a time-series forecast with the linear regression, but this does not explore the factors that drive revenue. With Multiple Regression you can forecast revenue based on factors like
- Price of the goods or services being sold
- Inflation
- Growth in the market sector
- Marketing spend
The regression analysis will use algorithms to determine the best relationship between Revenue and all given independent variables.
Advantages & Disadvantages of Quantitative Forecasting Methods
Advantages
- Objective and data-driven approach
- Ability to handle large datasets
- Suitable for short-term forecasting
- Provides precise numerical estimates
Disadvantages
- Relies heavily on historical data quality and availability
- May not capture qualitative factors or sudden changes in trends
- Assumes patterns will continue into the future
- Can be complex and time-consuming to implement
Qualitative Forecasting Methods
Qualitative forecasting methods rely on expert judgments, market surveys, and subjective assessments rather than mathematical models. These methods are often employed when historical data is limited or when dealing with new products, services, or markets.
Delphi Method
The Delphi method is a structured communication technique that involves gathering opinions from a panel of experts. In this method, experts are asked to provide their forecasts anonymously, and their responses are summarised and shared with the group. The process is repeated until a consensus or convergence of opinions is reached.
Market Survey
Market surveys involve collecting data directly from potential customers, industry experts, or other stakeholders through questionnaires, interviews, or focus groups. These surveys aim to gather insights into market trends, consumer preferences, and future demand, which can inform forecasting models.
Sales Force Composite
The sales force composite method utilizes the collective knowledge and experience of an organisation’s sales team. Sales representatives, who have direct contact with customers and market conditions, provide their estimates and insights, which are then aggregated to create a comprehensive forecast.
Executive Opinion
Executive opinion is a qualitative forecasting method that relies on the expertise and judgment of senior management or industry leaders. These individuals possess extensive knowledge and experience in their respective fields and can provide valuable insights into market dynamics, competitive landscapes, and future trends.
Advantages & Disadvantages of Qualitative Forecasting Methods
Advantages
- Incorporates expert knowledge and market insights
- Useful when historical data is limited or unavailable
- Captures qualitative factors and sudden changes in trends
- Suitable for long-term forecasting and strategic planning
Disadvantages
- Subjective and prone to biases
- Relies on the expertise and judgment of individuals
- May lack precision and numerical estimates
- Consensus among experts can be challenging to achieve
How to Select the Right Forecasting Method
Choosing the appropriate forecasting method is crucial for obtaining accurate and reliable results. The selection process should consider several factors, including the nature of the data, the time horizon, the complexity of the problem, and the availability of resources.
Understand the Data
Before selecting a forecasting method, it is essential to thoroughly analyse the available data. Assess the quality, completeness, and patterns within the data, as well as any potential outliers or anomalies.
Consider the Time Horizon
The time horizon for the forecast plays a significant role in determining the appropriate method. Short-term forecasts may rely on simpler techniques, such as moving averages or linear regression, while long-term forecasts often require more complex models or qualitative methods.
Evaluate the Complexity
Some forecasting problems are inherently more complex than others, involving multiple variables, non-linear relationships, or external factors. In such cases, more advanced methods like multiple regression or time series analysis may be required to capture the underlying complexities.
Assess Available Resources
The selection of a forecasting method should also consider the available resources, including time, computational power, and expertise. Certain methods may require specialised software, extensive data processing, or advanced statistical knowledge.
Combine Methods
In some instances, combining multiple forecasting methods can yield more accurate and robust results. This approach, known as ensemble forecasting, leverages the strengths of different techniques and can provide a more comprehensive understanding of future trends.
Regularly Update and Refine Forecasting Models
Financial forecasting is an ongoing process that requires regular updates and refinements to maintain accuracy and relevance. As new data becomes available and market conditions evolve, it is essential to revisit and adjust forecasting models accordingly. This iterative approach ensures that forecasts remain aligned with the current business environment and can adapt to changing circumstances.
Handling Conflicting Forecasting Results
In some cases, different forecasting methods may yield conflicting results, leading to uncertainty in decision-making. When faced with such situations, consider the following approaches:
Analyze the Underlying Assumptions
Examine the assumptions and inputs used in each forecasting method. Identify any differences or inconsistencies that may contribute to the conflicting results. Assess the validity and relevance of each assumption in the current context.
Assign Weights to Different Methods
Based on the reliability, historical accuracy, and relevance of each forecasting method, assign appropriate weights to their respective results. This approach allows for a more balanced consideration of different methods and can help reconcile conflicting outcomes.
Seek Expert Opinion
Consult with subject matter experts, industry professionals, or experienced forecasters to gain additional insights and perspectives on the conflicting results. Their expertise can help identify potential reasons for the discrepancies and provide guidance on how to interpret and reconcile the findings.
Conduct Sensitivity Analysis
Perform sensitivity analysisv to assess how changes in key assumptions or inputs affect the forecasting results. By varying these factors within reasonable ranges, you can identify the most critical variables and understand the robustness of each forecasting method.
Monitor and Adjust
Continuously monitor the actual performance against the forecasted values. As new data becomes available, compare it with the predictions from different methods. Adjust the forecasting models based on the observed discrepancies and refine them over time to improve their accuracy and reliability.
Financial forecasting is a critical component of effective decision-making and strategic planning in the finance domain. By employing various forecasting techniques, organisations can gain valuable insights into future trends, optimise resource allocation, and mitigate risks. Whether relying on quantitative methods, qualitative approaches, or a combination of both, it is essential to select the appropriate forecasting method based on the nature of the data, the time horizon, the complexity of the problem, and available resources. Continuous monitoring and refinement of forecasting models are also crucial to ensure their accuracy and relevance in an ever-changing business landscape.