Basic Excel Formulas for Finance Professionals
In the fast-paced world of finance, data is king. From tracking stock prices and analysing market trends to managing budgets and forecasting cash flows, finance professionals rely heavily on accurate and up-to-date data. Microsoft Excel has long been the go-to tool for crunching numbers and performing advanced financial analysis. However, to truly harness the power of this versatile software, a solid understanding of basic Excel formulas is essential.
Excel is an indispensable tool for finance professionals, as it allows them to efficiently manage and analyze large amounts of data. Mastering basic Excel formulas can greatly enhance productivity, reduce errors, and facilitate better decision-making. By leveraging the power of these formulas, finance professionals can streamline their workflows, uncover valuable insights, and ultimately drive better financial outcomes for their organizations.
Article Contents
-
- Basic Excel Formulas and Functions for Finance
- Key Excel Formulas for Basic Number-Crunching (SUM, AVERAGE, MIN, MAX, COUNT, IF)
- Data retrieval formula – such as VLOOKUP, XLOOKUP
- Logical Operations in Financial Modelling (AND, OR, and NOT)
- Dynamic Formulas for Market Analysis (TODAY and NOW)
- Using Excel Formulas for Budgeting and Forecasting
- Advanced Excel Formulas for Finance Professionals
Key Takeaways
| Aspect | Key Takeaways |
| Essential Formulas |
|
| Advanced Formulas |
|
| Dynamic Formulas |
|
| Best Practices |
|
| Applications |
|
| Advanced Skills |
|
Basic Excel Formulas and Functions for Finance
At its core, Excel is a calculation powerhouse. Even the most complex financial models are built upon a foundation of basic functions, formulas and built-in data tools. Mastering these fundamentals is an essential skill for finance professionals who need to navigate through vast amounts of data and perform intricate calculations with reliability.
While Excel offers a wide range of formulas and functions, some of the most commonly used ones in finance include:
- =SUM: This function adds up a range of values, making it indispensable for calculating totals, summing up expenses, or aggregating financial data.
- =AVERAGE: As the name suggests, this function calculates the arithmetic mean of a set of numbers, which is widely used in financial analysis, budgeting, and forecasting.
- =MEDIAN: The MEDIAN function returns the middle value in a set of numbers, which can be useful for identifying the typical value in a dataset and mitigating the impact of outliers.
- =COUNT: This function counts the number of cells containing numerical data, which can be useful for tracking the number of transactions, investments, or data points.
- =PMT: The PMT function calculates the periodic payment for a loan or investment, making it a valuable tool for loan amortization schedules and investment projections.
- =IRR: The Internal Rate of Return (IRR) function is essential for evaluating the profitability of investments by calculating the annualized rate of return.
- =NPV: The net present value of a series of numbers (cash flows) can be calculated quickly and reliably without the need for calculating discount factors.
These are just a few examples of the many formulas and functions available in Excel. By mastering these basic tools, finance professionals can streamline their workflows, reduce manual data entry, and minimize the risk of errors.
Key Excel Formulas for Basic Number-Crunching (SUM, AVERAGE, MIN, MAX, COUNT, IF)
While Excel offers a vast array of formulas and functions, some of the most fundamental ones revolve around basic number-crunching operations. These formulas are the building blocks for more advanced financial analysis and modelling. Let’s explore some of the key formulas in this category:
=SUM
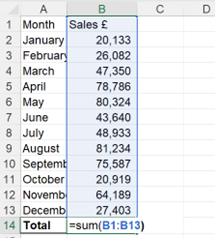
The SUM function is arguably one of the most widely used formulas in Excel. It adds up a range of values, making it indispensable for calculating totals, summing up expenses, or aggregating financial data. For example, you can use the SUM function to calculate the total revenue for a given period or to sum up the values in a portfolio.
=AVERAGE
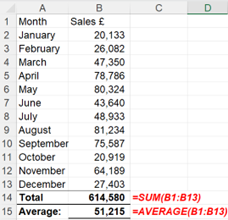
The AVERAGE function calculates the arithmetic mean of a set of numbers. This function is widely used in financial analysis, budgeting, and forecasting. For instance, you can use it to calculate the average monthly expenses or the average return on investment for a particular asset class.
MIN and MAX
These functions return the smallest and largest values in a given range, respectively. In finance, these functions can be useful for identifying the highest and lowest stock prices, tracking extreme market movements, or determining the minimum and maximum values in a dataset.
Try it for the series of numbers above!
COUNT
The COUNT function counts the number of cells containing numerical data. This can be useful for tracking the number of transactions, investments, or data points in a financial dataset. Additionally, you can use variations of the COUNT function, such as COUNTA and COUNTBLANK, to count non-numeric values or blank cells, respectively.
IF
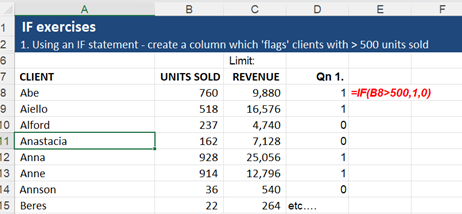
The IF function is a logical function that allows you to perform conditional operations based on a specified criterion. The function logic follows our human logic very closely, so it is probably the most commonly used function – perhaps over-used!
The logic is essential: IF a test condition is satisfied, give one outcome / solution, else give the alternative outcome. In this example below – you can see the formula translated as “if the number in cell B8 is greater than 500, the result is ‘1’, else it is ‘0’”. So we are just flagging up which clients have a sale of more than 500 units. The formula has been copied down column D to flag up 1 or 0 for all the clients.
In finance, this function is invaluable for creating decision trees, implementing business rules, and automating repetitive tasks. For example, you can use the IF function to categorize investments based on their risk profile or to apply different tax rates based on income thresholds.
=COUNTIF
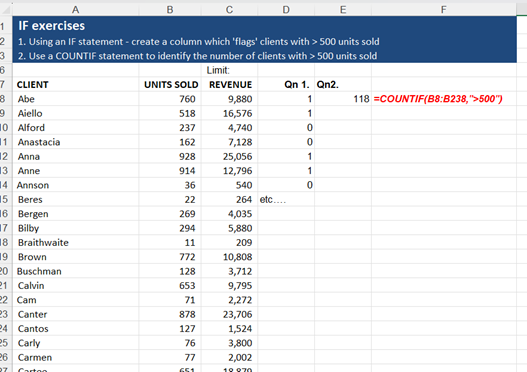
This is categorized as an ‘advanced if’ function by Excel! Why? The logic is not complex, but the syntax for the function can be a bit fiddle. The logic is that the function will count the number of cells in a specified range that satisfy a given condition. Below, we are counting the number clients with sales over 500 units: it’s 118.
Data retrieval formula – such as VLOOKUP, XLOOKUP
These lookup functions allow you to search for and retrieve data from a specified range or table based on a given criterion. VLOOKUP searches for a value in the leftmost column of a table and returns a corresponding value from a specified column. XLOOKUP, on the other hand, is a more versatile function that can search for values in any column and return corresponding results from alternative columns. Let’s see XLOOKUP in action – if you can use XLOOKUP then there is no need to learn VLOOKUP!

The Xlookup asks for several criteria in its formulation:
![]()
- $B$10 here is the value or text that Excel will search for….
- $B$5:$B$7 is where it will look for that value / text
- C5:C7 is the corresponding value that excel will return using this function
In this case, it is looking for “Scenario 2” text from B10, finding it in the second row of the “lookup array” (B5 to B7) and giving a result from the corresponding row in the “return array” being C5 to C7.
Using the $ and then copying the formula across row 10 gives a series corresponding to Scenario 2. If the text in B10 is changed to “Scenario 1” then excel will flip the data appropriately. It’s a great way to introduce scenarios into financial models. You need to look at our Excel Modelling eLearning to really get to grips with this – and we introduce switches as well, to save users have to type in scenario names.
These type of lookup functions are particularly useful in finance for tasks such as matching transaction IDs, looking up stock prices, or retrieving account information from a master list, or retrieving data from different scenarios – as we saw.
Logical Operations in Financial Modelling (AND, OR, and NOT)
Financial modelling often involves complex decision-making processes and the evaluation of multiple criteria simultaneously. Excel’s logical functions, such as AND, OR, and NOT, provide a powerful toolset for implementing these logical operations within your financial models.
AND
The AND function returns TRUE if all the specified conditions are met, and FALSE otherwise. In finance, you can use the AND function to set conditions for investment decisions, budget allocations, or loan approvals based on multiple criteria. For example, you could use the AND function to identify potential investments that meet specific risk and return thresholds.
OR
The OR function returns TRUE if at least one of the specified conditions is met, and FALSE if none of the conditions are met. This function can be useful in financial modelling when you need to consider alternative scenarios or account for multiple possibilities. For instance, you could use the OR function to identify potential customers who meet certain income or credit score criteria.
IF(AND(…)) and IF(OR(…))
The AND and OR functions are most commonly used in conjunction with IF – so you can arrive at appropriate results IF several conditions are met (AND) or if one of several conditions is met (OR). For example:
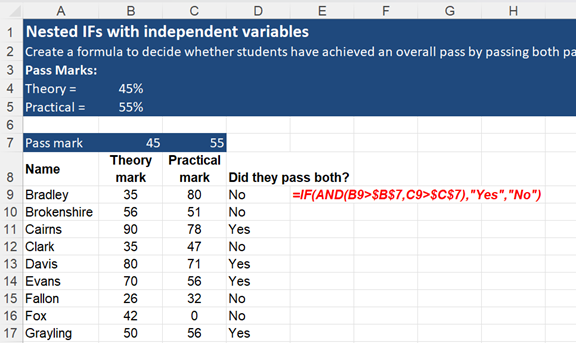
So the two conditions that both need satisfying are: 1. The Theory mark is >45 AND the Practical mark is >55. You can see both these tests in the formula above. The $s ensure that when the formula is copied down the page, the cell references are fixed.
NPV and IRR
The NPV function returns the present value of a stream regular-frequency cash flows using a given discount rate. For example, if discounting cash flows to find the value of a business or a project.
Note: the function will discount back to 1 period before the first identified cash flow. One way to address the problem of irregular cashflows is to use the XNPV function which adjusts correctly for precise dates of cash flows, as stated in your model:

Here, you can see the series of cash flows – an investment of £900,000 followed by regular, annual cash inflows for 5 years.
Using NPV function: note that we have excluded the £900,000 investment outflow in the NPV function. Why? Assuming today’s date is 11 July 2024, the £900,000 should not be discounted – it is already a present value. The formula will discount the number if you include it! So we have allowed for it as an add on to the NPV (you can see the “+E11” at the end of the formula.
Using XNPV, you can see we select the rate, the numbers, but also the dates. We get a very slightly lower number of £100,012.2. That’s because XNPV is accurate enough to allow for the extra day in the 2028 leap year!
IRR and XIRR
Similarly, rather IRR and XIRR can be used to determine the compound average rate of return implied by these cash flows. Commonly used in private equity modelling. So the IRR is 15.46/7% depending on which formula you use.
NOT
The NOT function returns the opposite logical value of its argument. It can be used to negate a condition or reverse a logical operation. In finance, the NOT function can be useful for identifying exceptions, filtering out unwanted data, or implementing exclusion criteria in your models.
By combining these logical functions with other Excel formulas and functions, you can create sophisticated financial models that accurately reflect the complexities of real-world scenarios. These models can help you make informed decisions, mitigate risks, and optimize your financial strategies.
Dynamic Formulas for Market Analysis (TODAY and NOW)
In the ever-changing world of finance, keeping your data and analyses up to date is crucial. Excel’s dynamic formulas, such as TODAY and NOW, can help you automate this process, ensuring that your financial models and reports always reflect the latest information.
TODAY
The TODAY function returns the current date, based on the system date of your computer. This function is particularly useful when you need to incorporate the latest date into your financial models or reports. For example, you could use the TODAY function to automatically update the “as of” date in your investment portfolio summary or to track the date of the latest market data update.
NOW
Similar to the TODAY function, the NOW function returns the current date and time, based on your computer’s system clock. This function can be valuable when you need to timestamp transactions, log trading activities, or record the exact time when a specific market event occurred.
By incorporating dynamic formulas like TODAY and NOW into your Excel models and reports, you can ensure that your analyses always reflect the most up-to-date information. This can be particularly important in the fast-paced world of finance, where market conditions can change rapidly, and timely decision-making is crucial.
Common Mistakes to Avoid When Using Excel Formulas in Finance
While Excel formulas are powerful tools for financial analysis, it’s essential to be aware of common mistakes that can lead to inaccurate results or flawed decision-making. Some of these mistakes include:
- Incorrect cell referencing: Ensure that your formulas reference the correct cells or ranges. Incorrect cell referencing can result in erroneous calculations and skewed results.
- Overlooking the order of operations: Excel follows a specific order of operations (PEMDAS) when evaluating formulas. Neglecting this order can lead to incorrect calculations, so use parentheses to ensure the desired calculation sequence.
- Not updating formulas when copying or moving data: When you copy or move data, make sure to update any associated formulas to reflect the new cell references. Failing to do so can result in formulas referencing the wrong data.
- Overwriting formulas with static values: Be cautious when editing cells containing formulas. Accidentally overwriting a formula with a static value can break the logic of your spreadsheet and lead to inaccurate results.
- Not auditing your formulas: Regularly audit your formulas to ensure they are accurate and functioning as intended. Use tools like Excel’s Formula Auditing feature to trace cell dependencies and identify potential errors.
By being mindful of these common mistakes and implementing best practices for formula usage, finance professionals can ensure the accuracy and reliability of their Excel-based analyses.
Using Excel Formulas for Budgeting and Forecasting
Excel formulas can be invaluable tools for budgeting and forecasting in finance. By leveraging the power of these formulas, finance professionals can create dynamic, data-driven models that help them plan for the future and make informed decisions. Some key applications of Excel formulas in budgeting and forecasting include:
- Projecting revenues and expenses: Use formulas like SUM, AVERAGE, and GROWTH to project future revenues and expenses based on historical data and growth assumptions.
- Scenario analysis: Utilize logical functions like IF, AND, and OR to create multiple scenarios within your budget or forecast, allowing you to assess the potential impact of different variables on your financial outcomes.
- Sensitivity analysis: Employ data tables and formulas to perform analysis, which helps you understand how changes in key assumptions (e.g., interest rates, market demand) can affect your budgeted or forecasted results.
- Dynamic updating: Incorporate dynamic formulas like TODAY and NOW to ensure that your budgets and forecasts always reflect the most current data and assumptions.
By harnessing the power of Excel formulas in budgeting and forecasting, finance professionals can create more accurate, flexible, and responsive financial plans that help their organizations navigate the complexities of the business landscape.
Advanced Excel Formulas for Finance Professionals
While mastering basic Excel formulas is essential for finance professionals, there are also many advanced formulas that can further enhance your analytical capabilities and streamline your workflows. Some advanced Excel formulas that finance professionals should consider learning include:
- OFFSET and INDEX: These functions are powerful tools for dynamic referencing and data extraction. OFFSET allows you to reference a cell or range that is a specified number of rows and columns away from a starting point, while INDEX returns a value from a specified cell within a range.
- SUMIFS and COUNTIFS: We’ve looked at COUNTIF above – COUNTIFS works for multiple conditions, and there is a similar SUMIF(S) for summing the numbers in a range if they satisfy a certain condition. These functions are advanced versions of the SUMIF and COUNTIF functions, allowing you to sum or count values based on multiple criteria. They are particularly useful for analysing complex datasets with multiple conditions.
- LOOKUP functions (VLOOKUP, HLOOKUP, XLOOKUP): We see these as so fundamental that we’ve already covered XLOOKUP above. It’s worth looking at the complete family of these if you get a chance. These functions are essential for looking up and retrieving data from tables or ranges based on specified criteria. XLOOKUP, however, is the most recent and versatile of these functions, offering enhanced flexibility and performance compared to its predecessors.
- Array formulas: Array formulas are powerful tools that perform multiple calculations on one or more sets of values, returning either a single result or an array of results. They can be used for complex calculations, such as matrix operations, conditional summing, and more.
By mastering these advanced Excel formulas, finance professionals can take their analytical skills to the next level, unlocking new insights and driving better decision-making within their organizations.
Excel formulas are an indispensable tool for finance professionals, enabling them to efficiently manage, analyse, and interpret vast amounts of financial data. By mastering basic formulas for number-crunching, data cleaning, logical operations, and dynamic analysis, finance professionals can streamline their workflows, reduce errors, and generate valuable insights that drive better decision-making.
As you continue your journey with Excel in finance, remember that the key to success lies in continuous learning, practice, and application. By dedicating yourself to mastering the power of Excel formulas, you’ll be well-equipped to tackle the challenges and opportunities that lie ahead in your financial career.