Dividend Coverage Ratio (DCR) Explained: Definitions, Formulas, and Examples
Dividend coverage is an important risk metric for equity analysts and investors, spotlighting a company’s ability to pay dividends to its shareholders. The dividend coverage ratio (DCR) serves as a crucial metric to gauge how secure a dividend payment. This article calculates the dividend coverage ratio and its interpretation supported by tangible examples and exercises to enhance your understanding of dividend coverage analysis.
Article Contents
Key Takeaways
| Takeaway | Description |
|---|---|
| Definition of DCR | The dividend coverage ratio quantifies how many times a company can pay its current dividend from its net income. |
| DCR Formula | DCR = Net Income / Cash Dividends |
| Interpretation |
|
| Industry Differences | Acceptable DCRs vary by industry based on growth vs cash generation. High growth tech companies often have high DCRs to fund growth, while mature FMCG companies have lower DCRs reflecting high cash generation and dividends. |
| Monitoring DCR | Corporate finance professionals monitor DCR to ensure dividend continuity and assess financial health. A declining DCR may shake confidence and require pivots to improve. |
What is the Dividend Coverage Ratio?
The dividend coverage ratio quantifies how many times a company can pay its current dividend from its net income.
The average dividend cover for UK companies is around 2.2 times. This means that broadly companies pay out 45% or so of profits, retaining the rest to strengthen the balance sheet, fund acquisitions, capital expenditure or other growth initiatives. A higher DCR signifies that the company has ample earnings or net income to uphold its dividend payments, while a lower DCR hints at potential struggles to maintain dividends in the face of dwindling earnings.
DCR Formula
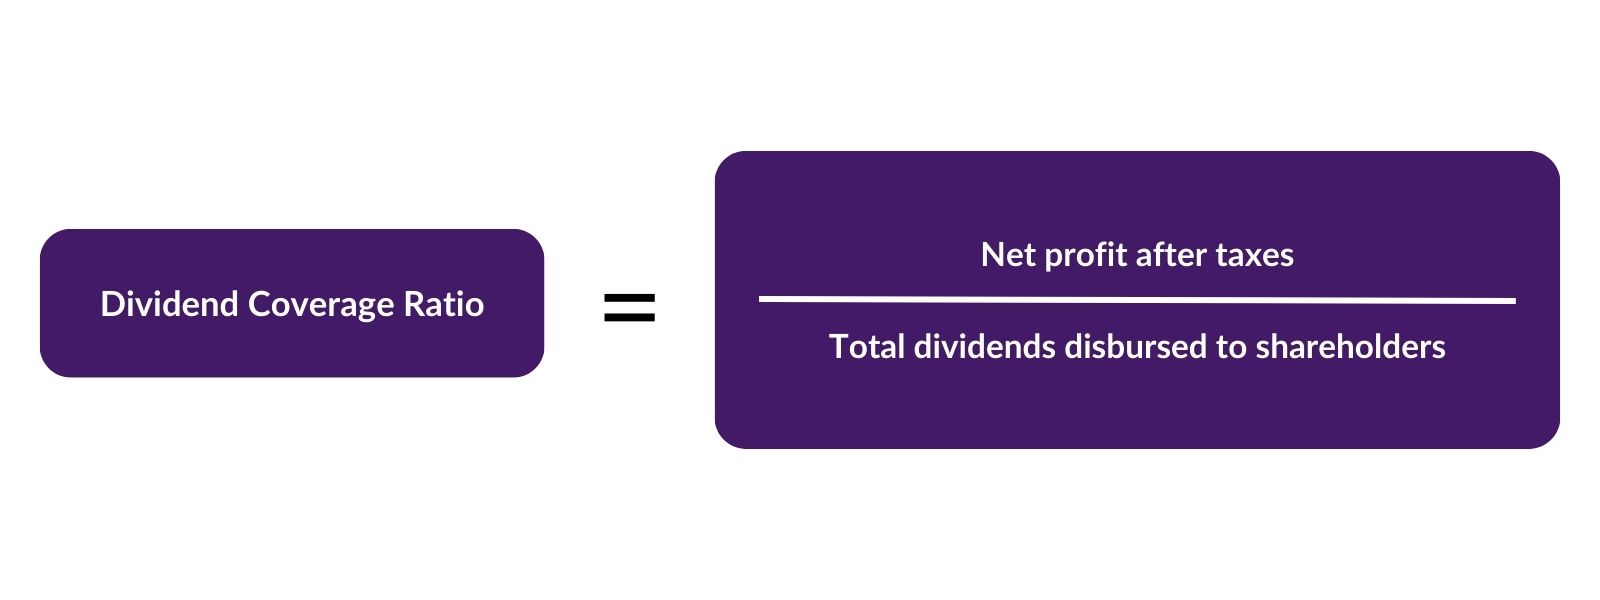
The formula to calculate the dividend coverage ratio is concise and straightforward:
DCR = Net Income / Cash Dividends
Where:
- Net Income = Net profit after taxes
- Cash Dividends = Total dividends disbursed to shareholders

An interesting qualification here is do we consider statutory net income (i.e. after exceptional items or on a before exceptionals or “adjusted basis”)? A company involved in major M&A may have to expense significant deal related fees and also spend significant sums on restructuring to yield recurring synergies. You as an analyst might reasonably consider these to be akin to capital expenditure. If so, you would be justified in calculating a forecast pro-forma net income adjusting for the expected increase in earnings from the acquisition but ignoring “one-off costs of integration”.
How to Calculate Dividend Coverage Ratio in Excel
Calculating DCR in Excel is a straightforward process:
- Enter the company’s net income in cell A1.
- Position the total cash dividends paid in cell B1.
- In cell C1, integrate the formula =A1/B1.
- Your dividend coverage ratio will appear in cell C1.
- Drag the formula downward to autopopulate for multiple periods or years.
Interpreting the Dividend Coverage Ratio in Corporate Finance
In corporate finance, the DCR is interpreted as follows:
- A DCR below 1 indicates an inability to cover dividends. There is a significant risk that future dividends may be cut.
- A DCR between 1 and 2 is perceived as weak coverage.
- A DCR of 2 or above is comfortable coverage.
DCR Across Industries
Acceptable DCRs can vary from industry to industry. A high growth technologically-oriented firm might have a high DCR reflecting a low dividend, allowing the company to focus on reinvesting cash in growth. For many years Microsoft and Apple did not pay dividends. At that time Bill Gates’ publicly stated view was that the best thing Microsoft could do with profits was reinvest in growth. The mature highly cash generative sector of fast-moving consumer goods “FMCG” is characterise by companies with lower dividend cover. This simply reflects their high cash generation, stability of profits and relatively small capex required to fund organic growth.
Corporate boards of mature businesses will often have an explicit policy regarding maintaining a specific DCR or dividend payout ratio, understanding that dividends signal stability and inherently influence stock prices. A weakening DCR might shake investor confidence, prompting a re-evaluation of investment strategies.
Exercises and Examples for DCR
Exercise 1:
Company A reports a net income of $5 million and cash dividends of $2 million.
What is its DCR?
Solution:
DCR = Net Income / Cash Dividends = $5 million / $2 million = 2.5
Example 2:
Company B reveals a net income of $3.5 million and dividend payments of $1.5 million.
How robust is its dividend cover?
Solution:
Dividend cover = Net profit / Total dividends = $3.5 million / $1.5 million = 2.33
Therefore, Company B boasts a dividend cover of 2.33 times, indicative of sufficient coverage.
Case Study: ABC Corp’s DCR Strategy
ABC Corp, an established entity in the retail sector, faced a plummeting DCR amidst a challenging fiscal year due to an unforeseen market downturn. Its DCR of 1.2 signalled weak coverage, potentially jeopardising its long track record for consistent dividends. To navigate this, ABC Corp implemented a strategic pivot, reallocating resources to enhance online sales and streamline operational costs. Within two fiscal quarters, a revitalised revenue stream and decreased expenditures improved the DCR to a sturdy 2.8, safeguarding dividends and restoring investor confidence.
The dividend coverage ratio is an instrumental metric in scrutinising a company’s dividend-paying capacity. Corporate financiers, investors and equity analysts monitor the DCR, safeguarding dividend continuity and evaluating financial health. While a lofty ratio reassures, a low ratio might herald financial storms on the horizon.


